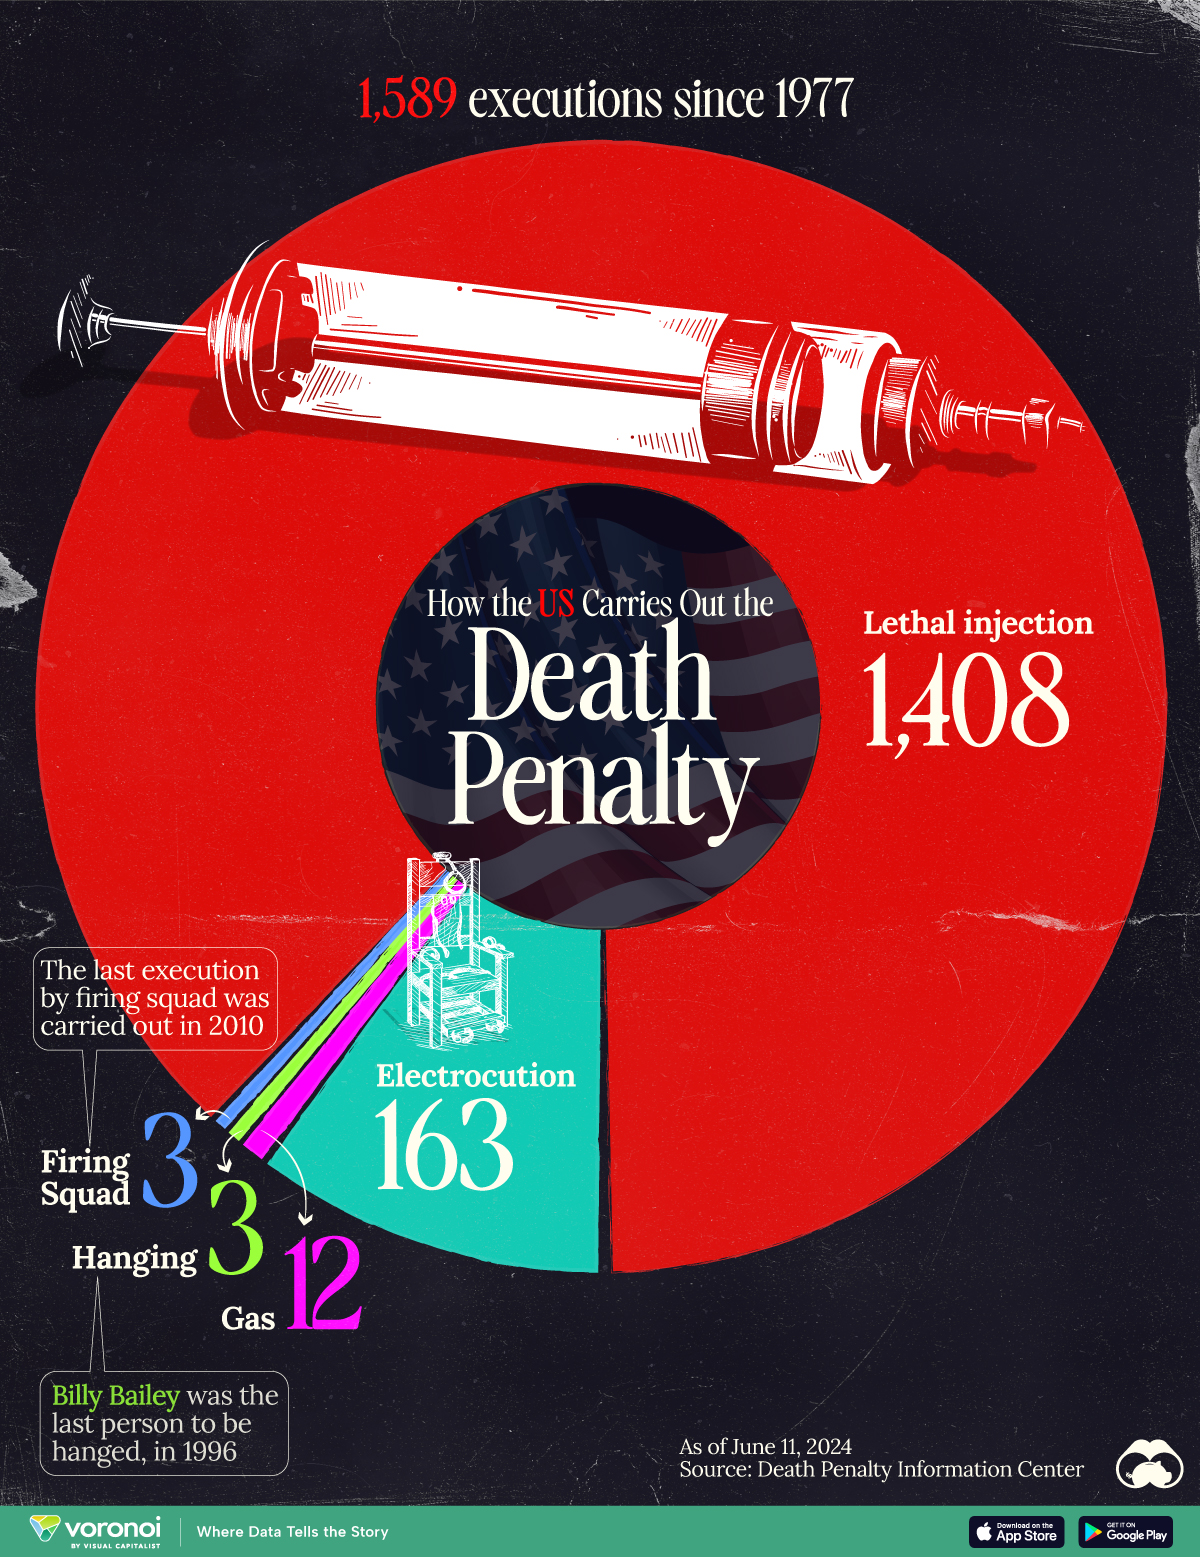
You are here

Social Issues

Comparing U.S. Federal Spending with Revenue

Comparing U.S. Federal Spending with Revenue

In 2021, the U.S. government spent $6.8 trillion on various expenditures and government-aided programs. Where was this money spent, and how much was covered by taxpayers’ dollars?

This graphic by Truman Du shows a breakdown of U.S. federal spending in 2021, as well as a breakdown of where the money came from, using data from USAspending.gov.

Visualizing Two Decades of Reported Hate Crimes in the U.S.

Visualizing Two Decades of Reported Hate Crimes in the U.S.

Across the U.S., thousands of hate crimes are committed each year, with many different motivating biases.

In 2020 alone, more than 10,000 unique hate crime incidents were reported to the Federal Bureau of Investigation (FBI)—and it’s likely that thousands more were committed that didn’t get reported to law enforcement.

Ranked: The 20 Countries With the Fastest Declining Populations

Can I share this graphic?Yes. Visualizations are free to share and post in their original form across the web—even for publishers. Please link back to this page and attribute Visual Capitalist.

When do I need a license?Licenses are required for some commercial uses, translations, or layout modifications. You can even whitelabel our visualizations. Explore your options.

Visualizing Gender Diversity in Corporate America

There’s been a massive push to increase diversity and inclusion in the workplace.

However, it appears corporate America still has a ways to go, particularly when it comes to diverse representation in corporate leadership roles. In 2021, only 8.2% of Fortune 500 CEOs were female. Of those females, 85% of them were white.

This graphic by Zainab Ayodimeji highlights the current state of diversity in corporate America, reminding us that there are still significant gender and racial gaps.

Five Decades of Fortune 500 CEOs

Pages