Published
23 mins ago
on
June 30, 2023
| 133 views
-->
By
Chris Dickert
Graphics & Design
- Zack Aboulazm
The following content is sponsored by Greenbutts
View the full-size version of this graphic
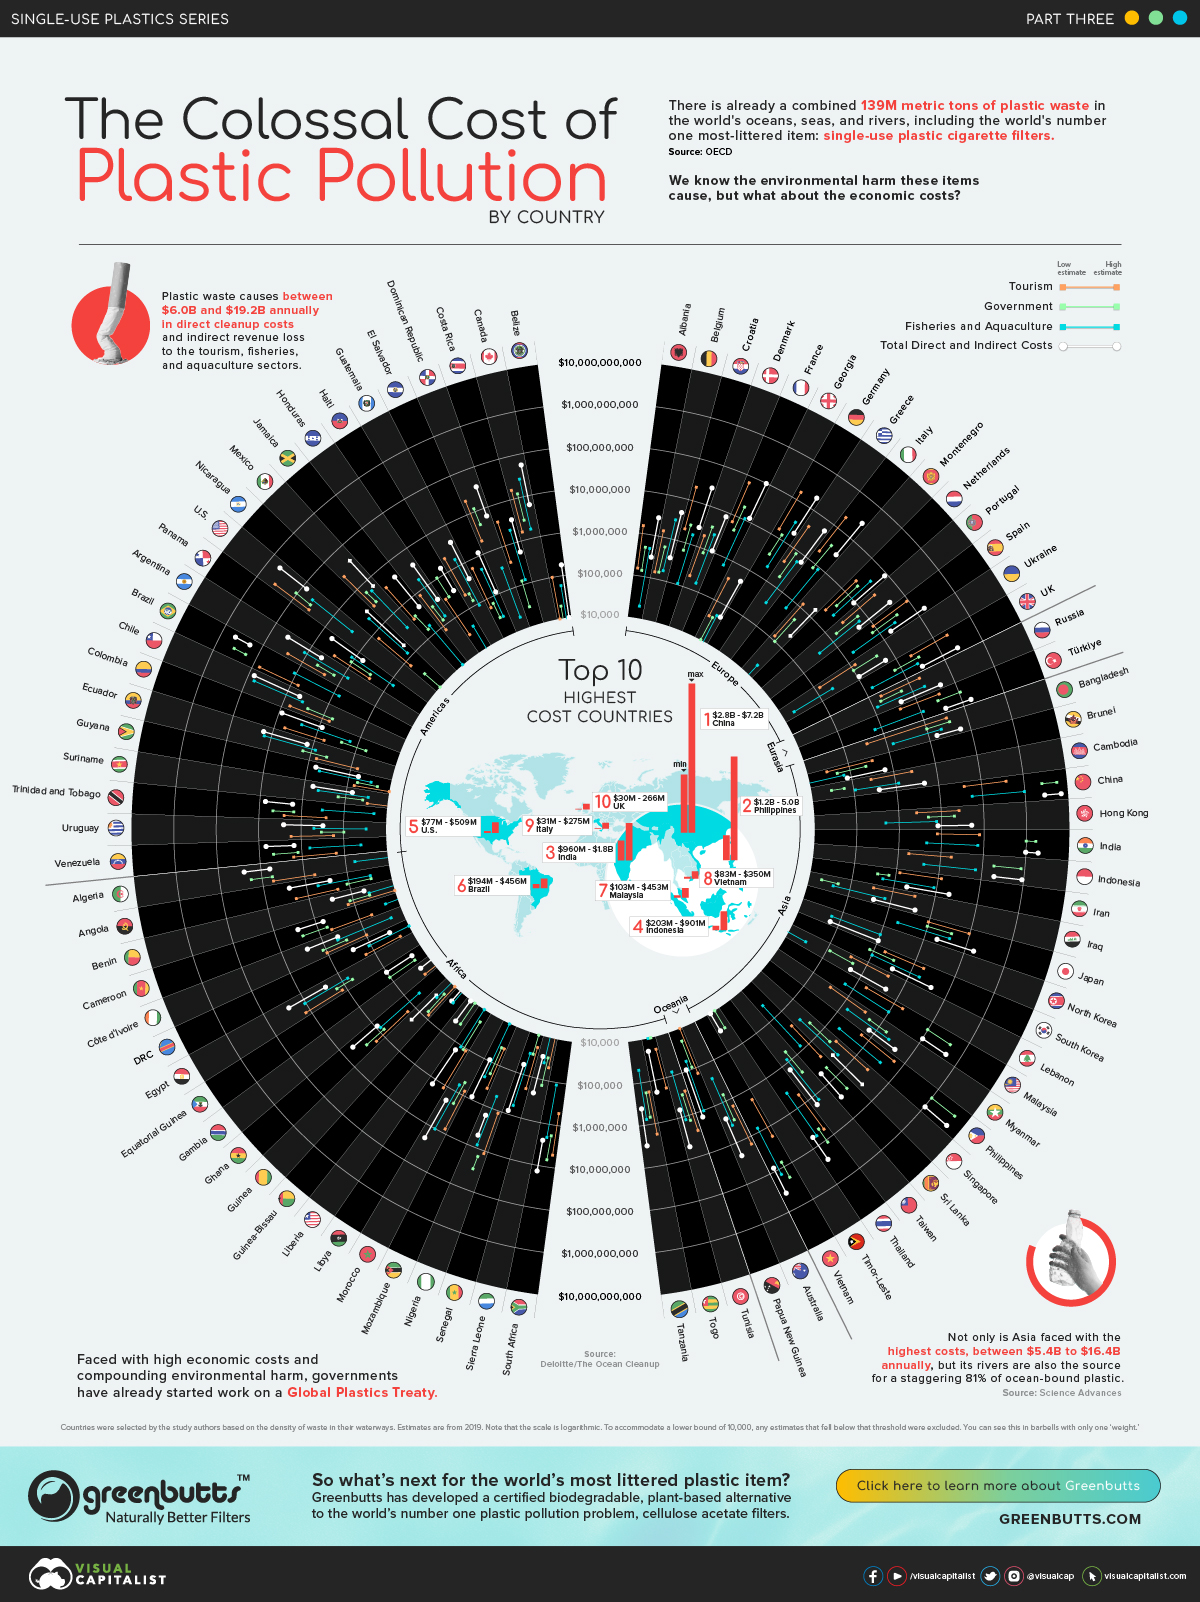
The Cost of Plastic Pollution, By Country
There is now a combined 139 million tons of plastic pollution in the world’s oceans, seas, and rivers, including the world’s number one most littered item: single-use cigarette filters.
And while we know plastic waste has a massive environmental impact, what are the associated economic costs?
Using estimates developed by Deloitte for The Ocean Cleanup, this data visualization maps the cost of plastic pollution for the third and final piece in the Single-use Plastic Series for our sponsor Greenbutts.
The Price Tag of Plastic Pollution
Deloitte’s 2019 Price Tag of Plastic Pollution study uses a novel assessment model to estimate the economic costs of marine litter, which typically flows from rivers and into the ocean.
The resulting estimates for 87 countries cover direct government costs, and the revenue lost to tourism, and fisheries and aquaculture.
If you take the UK, for example, the direct costs borne by the government were between $7.1 and $31.7 million, but the report estimated the total costs to be between $29.6 and $266.2 million.
Deloitte and the Ocean Cleanup selected countries to include on the basis of the waste density of the subject’s waterways.
Paying the Piper
Every year, plastic pollution costs coastal countries between $6.0 and $19.2 billion.
| Country or territory | Sector | Lower estimate | Upper estimate |
|---|---|---|---|
| Angola | Fisheries & Aquaculture | $30,000 | $530,000 |
| Angola | Government | $30,000 | $110,000 |
| Angola | Tourism | $200,000 | $1,950,000 |
| Albania | Tourism | $150,000 | $1,480,000 |
| Albania | Fisheries & Aquaculture | $20,000 | $450,000 |
| Albania | Government | $130,000 | $490,000 |
| Argentina | Fisheries & Aquaculture | $750,000 | $12,580,000 |
| Argentina | Government | $1,500,000 | $4,420,000 |
| Argentina | Tourism | $2,400,000 | $23,970,000 |
| Australia | Fisheries & Aquaculture | $230,000 | $3,830,000 |
| Australia | Government | $680,000 | $3,030,000 |
| Australia | Tourism | $1,450,000 | $14,530,000 |
| Belgium | Fisheries & Aquaculture | $170,000 | $2,820,000 |
| Belgium | Government | $140,000 | $590,000 |
| Belgium | Tourism | $130,000 | $1,290,000 |
| Benin | Fisheries & Aquaculture | $0 | $40,000 |
| Benin | Government | $40,000 | $120,000 |
| Benin | Tourism | $10,000 | $130,000 |
| Bangladesh | Tourism | $330,000 | $3,310,000 |
| Bangladesh | Fisheries & Aquaculture | $1,300,000 | $21,620,000 |
| Bangladesh | Government | $13,350,000 | $37,970,000 |
| Belize | Fisheries & Aquaculture | $0 | $60,000 |
| Belize | Tourism | $10,000 | $100,000 |
| Belize | Government | $0 | $20,000 |
| Brazil | Fisheries & Aquaculture | $720,000 | $11,990,000 |
| Brazil | Government | $186,340,000 | $373,940,000 |
| Brazil | Tourism | $6,970,000 | $69,690,000 |
| Brunei | Fisheries & Aquaculture | $0 | $70,000 |
| Brunei | Government | $50,000 | $230,000 |
| Brunei | Tourism | $30,000 | $340,000 |
| Canada | Fisheries & Aquaculture | $1,620,000 | $27,100,000 |
| Canada | Government | $2,880,000 | $12,990,000 |
| Canada | Tourism | $1,600,000 | $16,020,000 |
| Chile | Fisheries & Aquaculture | $3,910,000 | $65,230,000 |
| Chile | Government | $600,000 | $2,620,000 |
| Chile | Tourism | $660,000 | $6,610,000 |
| China | Fisheries & Aquaculture | $57,250,000 | $954,200,000 |
| China | Government | $2,674,690,000 | $5,853,540,000 |
| China | Tourism | $39,730,000 | $397,350,000 |
| Côte d'Ivoire | Fisheries & Aquaculture | $20,000 | $440,000 |
| Côte d'Ivoire | Government | $290,000 | $1,240,000 |
| Côte d'Ivoire | Tourism | $100,000 | $990,000 |
| Cameroon | Tourism | $50,000 | $480,000 |
| Cameroon | Fisheries & Aquaculture | $0 | $20,000 |
| Cameroon | Government | $610,000 | $2,470,000 |
| Democratic Republic of the Congo (DRC) | Fisheries & Aquaculture | $10,000 | $110,000 |
| Democratic Republic of the Congo (DRC) | Government | $0 | $0 |
| Democratic Republic of the Congo (DRC) | Tourism | $20,000 | $160,000 |
| Colombia | Fisheries & Aquaculture | $150,000 | $2,570,000 |
| Colombia | Tourism | $620,000 | $6,160,000 |
| Colombia | Government | $60,000 | $230,000 |
| Costa Rica | Fisheries & Aquaculture | $120,000 | $2,020,000 |
| Costa Rica | Government | $30,000 | $120,000 |
| Costa Rica | Tourism | $390,000 | $3,870,000 |
| Germany | Fisheries & Aquaculture | $2,010,000 | $33,500,000 |
| Germany | Government | $3,650,000 | $12,670,000 |
| Germany | Tourism | $15,010,000 | $150,120,000 |
| Denmark | Fisheries & Aquaculture | $140,000 | $2,420,000 |
| Denmark | Government | $810,000 | $3,630,000 |
| Denmark | Tourism | $200,000 | $1,980,000 |
| Dominican Republic | Fisheries & Aquaculture | $20,000 | $330,000 |
| Dominican Republic | Government | $4,630,000 | $12,030,000 |
| Dominican Republic | Tourism | $2,070,000 | $20,710,000 |
| Algeria | Tourism | $560,000 | $5,640,000 |
| Algeria | Fisheries & Aquaculture | $0 | $60,000 |
| Algeria | Government | $5,720,000 | $18,580,000 |
| Ecuador | Fisheries & Aquaculture | $850,000 | $14,120,000 |
| Ecuador | Government | $420,000 | $1,500,000 |
| Ecuador | Tourism | $70,000 | $710,000 |
| Egypt | Fisheries & Aquaculture | $710,000 | $11,750,000 |
| Egypt | Government | $550,000 | $1,550,000 |
| Egypt | Tourism | $1,210,000 | $12,070,000 |
| Spain | Fisheries & Aquaculture | $1,680,000 | $27,970,000 |
| Spain | Government | $7,660,000 | $37,320,000 |
| Spain | Tourism | $9,040,000 | $90,430,000 |
| France | Fisheries & Aquaculture | $650,000 | $10,750,000 |
| France | Government | $4,700,000 | $19,760,000 |
| France | Tourism | $6,940,000 | $69,400,000 |
| UK | Fisheries & Aquaculture | $1,470,000 | $24,540,000 |
| UK | Government | $7,140,000 | $31,680,000 |
| UK | Tourism | $21,000,000 | $209,980,000 |
| Georgia | Fisheries & Aquaculture | $0 | $50,000 |
| Georgia | Government | $10,000 | $40,000 |
| Georgia | Tourism | $40,000 | $370,000 |
| Ghana | Fisheries & Aquaculture | $50,000 | $830,000 |
| Ghana | Government | $670,000 | $2,740,000 |
| Ghana | Tourism | $160,000 | $1,650,000 |
| Guinea | Fisheries & Aquaculture | $0 | $30,000 |
| Guinea | Government | $20,000 | $70,000 |
| Guinea | Tourism | $10,000 | $80,000 |
| Gambia | Tourism | $0 | $20,000 |
| Gambia | Fisheries & Aquaculture | $0 | $0 |
| Gambia | Government | $0 | $0 |
| Guinea-Bissau | Fisheries & Aquaculture | $0 | $20,000 |
| Guinea-Bissau | Government | $0 | $0 |
| Guinea-Bissau | Tourism | $0 | $0 |
| Equatorial Guinea | Tourism | $0 | $0 |
| Equatorial Guinea | Fisheries & Aquaculture | $0 | $0 |
| Equatorial Guinea | Government | $20,000 | $100,000 |
| Greece | Tourism | $4,290,000 | $42,920,000 |
| Greece | Fisheries & Aquaculture | $360,000 | $5,910,000 |
| Greece | Government | $1,880,000 | $8,490,000 |
| Guatemala | Tourism | $210,000 | $2,080,000 |
| Guatemala | Fisheries & Aquaculture | $90,000 | $1,470,000 |
| Guatemala | Government | $120,000 | $200,000 |
| Guyana | Fisheries & Aquaculture | $30,000 | $500,000 |
| Guyana | Government | $20,000 | $60,000 |
| Guyana | Tourism | $10,000 | $70,000 |
| Hong Kong | Fisheries & Aquaculture | $450,000 | $7,550,000 |
| Hong Kong | Government | $5,100,000 | $20,150,000 |
| Hong Kong | Tourism | $2,470,000 | $24,680,000 |
| Honduras | Fisheries & Aquaculture | $160,000 | $2,760,000 |
| Honduras | Government | $130,000 | $330,000 |
| Honduras | Tourism | $80,000 | $770,000 |
| Croatia | Tourism | $2,100,000 | $21,000,000 |
| Croatia | Fisheries & Aquaculture | $110,000 | $1,780,000 |
| Croatia | Government | $640,000 | $2,820,000 |
| Haiti | Tourism | $30,000 | $290,000 |
| Haiti | Fisheries & Aquaculture | $0 | $40,000 |
| Haiti | Government | $300,000 | $1,100,000 |
| Indonesia | Fisheries & Aquaculture | $4,250,000 | $70,830,000 |
| Indonesia | Government | $196,530,000 | $813,230,000 |
| Indonesia | Tourism | $1,720,000 | $17,170,000 |
| India | Tourism | $7,420,000 | $74,210,000 |
| India | Fisheries & Aquaculture | $4,370,000 | $72,860,000 |
| India | Government | $948,160,000 | $1,655,590,000 |
| Iran | Fisheries & Aquaculture | $510,000 | $8,490,000 |
| Iran | Tourism | $1,170,000 | $11,740,000 |
| Iran | Government | $360,000 | $710,000 |
| Iraq | Fisheries & Aquaculture | $40,000 | $700,000 |
| Iraq | Tourism | $330,000 | $3,310,000 |
| Iraq | Government | $20,000 | $50,000 |
| Italy | Fisheries & Aquaculture | $540,000 | $8,920,000 |
| Italy | Tourism | $22,920,000 | $229,190,000 |
| Italy | Government | $7,570,000 | $37,180,000 |
| Jamaica | Fisheries & Aquaculture | $10,000 | $170,000 |
| Jamaica | Tourism | $370,000 | $3,730,000 |
| Jamaica | Government | $140,000 | $400,000 |
| Japan | Fisheries & Aquaculture | $2,070,000 | $34,390,000 |
| Japan | Tourism | $9,230,000 | $92,290,000 |
| Japan | Government | $9,480,000 | $38,170,000 |
| Cambodia | Tourism | $270,000 | $2,740,000 |
| Cambodia | Fisheries & Aquaculture | $110,000 | $1,750,000 |
| Cambodia | Government | $30,000 | $60,000 |
| South Korea | Fisheries & Aquaculture | $1,020,000 | $17,030,000 |
| South Korea | Tourism | $1,820,000 | $18,240,000 |
| South Korea | Government | $780,000 | $3,250,000 |
| Lebanon | Fisheries & Aquaculture | $0 | $30,000 |
| Lebanon | Tourism | $380,000 | $3,850,000 |
| Lebanon | Government | $120,000 | $470,000 |
| Liberia | Fisheries & Aquaculture | $0 | $0 |
| Liberia | Tourism | $0 | $0 |
| Liberia | Government | $10,000 | $40,000 |
| Libya | Fisheries & Aquaculture | $10,000 | $110,000 |
| Libya | Tourism | $110,000 | $1,140,000 |
| Libya | Government | $20,000 | $110,000 |
| Sri Lanka | Fisheries & Aquaculture | $40,000 | $790,000 |
| Sri Lanka | Government | $4,890,000 | $22,400,000 |
| Sri Lanka | Tourism | $240,000 | $2,370,000 |
| Morocco | Fisheries & Aquaculture | $640,000 | $10,650,000 |
| Morocco | Government | $510,000 | $1,840,000 |
| Morocco | Tourism | $770,000 | $7,660,000 |
| Mexico | Tourism | $2,790,000 | $27,910,000 |
| Mexico | Fisheries & Aquaculture | $330,000 | $5,430,000 |
| Mexico | Government | $3,120,000 | $6,310,000 |
| Myanmar | Fisheries & Aquaculture | $1,330,000 | $22,180,000 |
| Myanmar | Government | $5,330,000 | $16,490,000 |
| Myanmar | Tourism | $320,000 | $3,160,000 |
| Montenegro | Tourism | $120,000 | $1,210,000 |
| Montenegro | Fisheries & Aquaculture | $0 | $20,000 |
| Montenegro | Government | $100,000 | $460,000 |
| Mozambique | Tourism | $40,000 | $410,000 |
| Mozambique | Fisheries & Aquaculture | $10,000 | $230,000 |
| Mozambique | Government | $40,000 | $180,000 |
| Malaysia | Tourism | $1,850,000 | $18,530,000 |
| Malaysia | Fisheries & Aquaculture | $590,000 | $9,850,000 |
| Malaysia | Government | $100,550,000 | $424,360,000 |
| Nigeria | Fisheries & Aquaculture | $500,000 | $8,430,000 |
| Nigeria | Government | $14,500,000 | $31,450,000 |
| Nigeria | Tourism | $1,170,000 | $11,660,000 |
| Nicaragua | Tourism | $70,000 | $710,000 |
| Nicaragua | Fisheries & Aquaculture | $130,000 | $2,110,000 |
| Nicaragua | Government | $10,000 | $30,000 |
| Netherlands | Tourism | $2,380,000 | $23,840,000 |
| Netherlands | Fisheries & Aquaculture | $2,440,000 | $40,750,000 |
| Netherlands | Government | $4,240,000 | $19,830,000 |
| Panama | Tourism | $280,000 | $2,780,000 |
| Panama | Fisheries & Aquaculture | $80,000 | $1,230,000 |
| Panama | Government | $300,000 | $1,190,000 |
| Philippines | Fisheries & Aquaculture | $1,950,000 | $32,600,000 |
| Philippines | Tourism | $6,020,000 | $60,160,000 |
| Philippines | Government | $1,176,380,000 | $4,859,270,000 |
| Papua New Guinea | Tourism | $10,000 | $130,000 |
| Papua New Guinea | Fisheries & Aquaculture | $60,000 | $1,030,000 |
| Papua New Guinea | Government | $20,000 | $90,000 |
| North Korea | Tourism | $0 | $0 |
| North Korea | Fisheries & Aquaculture | $60,000 | $1,060,000 |
| North Korea | Government | $0 | $0 |
| Portugal | Tourism | $2,940,000 | $29,390,000 |
| Portugal | Fisheries & Aquaculture | $370,000 | $6,180,000 |
| Portugal | Government | $1,520,000 | $6,730,000 |
| Russia | Tourism | $1,820,000 | $18,190,000 |
| Russia | Fisheries & Aquaculture | $1,250,000 | $20,690,000 |
| Russia | Government | $1,520,000 | $6,100,000 |
| Senegal | Tourism | $20,000 | $190,000 |
| Senegal | Fisheries & Aquaculture | $30,000 | $580,000 |
| Senegal | Government | $10,000 | $30,000 |
| Singapore | Tourism | $2,760,000 | $27,610,000 |
| Singapore | Fisheries & Aquaculture | $280,000 | $4,780,000 |
| Singapore | Government | $470,000 | $2,080,000 |
| Sierra Leone | Tourism | $0 | $50,000 |
| Sierra Leone | Fisheries & Aquaculture | $0 | $40,000 |
| Sierra Leone | Government | $30,000 | $130,000 |
| El Salvador | Tourism | $60,000 | $640,000 |
| El Salvador | Fisheries & Aquaculture | $30,000 | $490,000 |
| El Salvador | Government | $30,000 | $70,000 |
| Suriname | Fisheries & Aquaculture | $30,000 | $440,000 |
| Suriname | Tourism | $0 | $30,000 |
| Suriname | Government | $40,000 | $140,000 |
| Togo | Fisheries & Aquaculture | $0 | $10,000 |
| Togo | Government | $0 | $10,000 |
| Togo | Tourism | $20,000 | $170,000 |
| Thailand | Fisheries & Aquaculture | $3,770,000 | $62,850,000 |
| Thailand | Government | $49,670,000 | $122,410,000 |
| Thailand | Tourism | $5,730,000 | $57,270,000 |
| Timor-Leste | Fisheries & Aquaculture | $0 | $0 |
| Timor-Leste | Government | $10,000 | $30,000 |
| Timor-Leste | Tourism | $0 | $0 |
| Trinidad and Tobago | Fisheries & Aquaculture | $20,000 | $320,000 |
| Trinidad and Tobago | Government | $1,480,000 | $4,450,000 |
| Trinidad and Tobago | Tourism | $250,000 | $2,470,000 |
| Tunisia | Fisheries & Aquaculture | $80,000 | $1,260,000 |
| Tunisia | Government | $310,000 | $1,330,000 |
| Tunisia | Tourism | $260,000 | $2,640,000 |
| Türkiye | Fisheries & Aquaculture | $690,000 | $11,440,000 |
| Türkiye | Government | $30,060,000 | $116,200,000 |
| Türkiye | Tourism | $3,530,000 | $35,280,000 |
| Taiwan | Tourism | $0 | $0 |
| Taiwan | Fisheries & Aquaculture | $810,000 | $13,360,000 |
| Taiwan | Government | $610,000 | $2,410,000 |
| Tanzania | Tourism | $170,000 | $1,720,000 |
| Tanzania | Fisheries & Aquaculture | $50,000 | $740,000 |
| Tanzania | Government | $180,000 | $670,000 |
| Ukraine | Fisheries & Aquaculture | $20,000 | $220,000 |
| Ukraine | Tourism | $120,000 | $1,200,000 |
| Ukraine | Government | $1,070,000 | $4,360,000 |
| Uruguay | Fisheries & Aquaculture | $30,000 | $510,000 |
| Uruguay | Government | $100,000 | $320,000 |
| Uruguay | Tourism | $170,000 | $1,740,000 |
| U.S. | Fisheries & Aquaculture | $2,620,000 | $43,750,000 |
| U.S. | Tourism | $35,280,000 | $352,800,000 |
| U.S. | Government | $39,020,000 | $112,170,000 |
| Venezuela | Fisheries & Aquaculture | $40,000 | $630,000 |
| Venezuela | Government | $1,290,000 | $4,580,000 |
| Venezuela | Tourism | $150,000 | $1,520,000 |
| Vietnam | Fisheries & Aquaculture | $8,000,000 | $133,340,000 |
| Vietnam | Government | $74,090,000 | $198,040,000 |
| Vietnam | Tourism | $1,860,000 | $18,590,000 |
| South Africa | Tourism | $530,000 | $5,270,000 |
| South Africa | Fisheries & Aquaculture | $120,000 | $2,000,000 |
| South Africa | Government | $1,810,000 | $6,600,000 |
The direct costs of cleaning coastlines, waterways, marinas, and ports make up the lion’s share, between $5.6 and $15.0 billion in government expenditures.
But clean-up costs aren’t the only impact. Polluted beaches and stranded debris also have an impact on tourism, estimated to be between $237.8 million and $2.4 billion.
And while the harm to marine ecosystems can’t be overstated, the cost to fisheries and aquaculture, and the communities that depend on them, is real. It adds up to between $114.4 million and $1.9 billion annually.
Streams of Plastic, Rivers of Pollution
But where does all this plastic come from?
According to the most recent estimates, as many as 1,656 rivers contribute 80% of the plastic pollution that makes it into the ocean. This 2021 study updates earlier estimates that pinned much of the blame on only a handful of rivers.
| River | Country | Share of global plastic pollution emitted to ocean |
|---|---|---|
| Pasig | Philippines | 6.43% |
| Tullahan | Philippines | 1.33% |
| Ulhas | India | 1.33% |
| Klang | Malaysia | 1.33% |
| Meycauayan | Philippines | 1.23% |
| Pampanga | Philippines | 0.95% |
| Libmanan | Philippines | 0.72% |
| Ganges | India | 0.63% |
| Rio Grande de Mindanao | Philippines | 0.54% |
| Agno | Philippines | 0.47% |
| Agusan | Philippines | 0.47% |
| Paranaque | Philippines | 0.45% |
| Iloilo | Philippines | 0.43% |
| Soai Rap | Vietnam | 0.42% |
| Chao Phraya | Thailand | 0.41% |
| Lagos Harbour | Nigeria | 0.41% |
| Hugli | India | 0.40% |
| Huangpu | China | 0.37% |
| Pazundaung Creek | Myanmar | 0.37% |
| Bharathappuzha | India | 0.36% |
| Ebrie Lagoon Komoe | Ivory Coast | 0.34% |
| Sarawak | Malaysia | 0.34% |
| Msimbazi River | Dar Es Salaam | 0.33% |
| Imus | Philippines | 0.32% |
| Chenzhen River | China | 0.30% |
| Wouri River | Cameroon | 0.29% |
| Langat | Malaysia | 0.29% |
| Cilliwung | Indonesia | 0.29% |
| Zapote | Philippines | 0.28% |
| Malad Creek | India | 0.28% |
| Kelani | Sri Lanka | 0.28% |
| Cagayan de Oro | Philippines | 0.27% |
| Davao River | Philippines | 0.27% |
| Karnaphuli | Bangladesh | 0.27% |
| Rio Pavuna | Brazil | 0.27% |
| Panvel Creek | India | 0.26% |
| Yangon River | Myanmar | 0.26% |
| Malaking Tubiq | Philippines | 0.26% |
| Zhujiang/Canton | China | 0.26% |
| Tambo, Pasay (storm drain) | Philippines | 0.26% |
| Kelantan | Malaysia | 0.26% |
| Jalaur River | Philippines | 0.23% |
| Douala Estuary | Cameroon | 0.23% |
| Chilyar | India | 0.23% |
| Periyar River | India | 0.23% |
| Cagayan River | Philippines | 0.23% |
| Sungai Kuantan | Malaysia | 0.22% |
| Mithi River | India | 0.22% |
| Rio Ozama | Dominican Republic | 0.22% |
| Hamulauon | Philippines | 0.22% |
The top 10 rivers are all in Asia. And this makes sense when you think about it. Asia is home to most of the world’s population and to many developing countries with poor waste management systems. Many parts of Asia, especially in the Southeast, also have heavy precipitation, which is a contributing factor. Proximity to a city is also important, as is the distance to the coast. In fact, the top three emitting rivers go through major coastal cities Manila, Kuala Lumpur, and Mumbai.
As a result, not only is Asia the biggest source of plastic pollution, a staggering 81% according to study authors, but it also has the highest direct and indirect costs from plastic pollution, between $5.4 and $16.4 billion per year.
So What’s to be Done?
The OECD estimated that global plastic pollution could nearly triple to 1.0 billion metric tons by 2060. And while they estimate that the share of plastic that escapes waste management systems will fall from 22% (2019) to 17% (2060), that’s still a lot of plastic to deal with.
Not surprisingly, the tide is turning against single-use plastics and many governments have already banned the worst offenders. Bangladesh was the first country to ban plastic bags in 2002, while the U.S. banned microbeads in personal care products in 2015, followed by the UK (2018), Canada (2018), and then China (2020-2022).
At the international level, 170 countries recently agreed to have a first draft of a global plastics treaty ready by November 2023.
Momentum is Growing Against Plastic Cigarette Filters
Single-use plastic cigarette filters, which routinely top the Ocean Conservancy’s annual International Coastal Cleanup, are also coming under scrutiny.
The EU’s Single-Use Plastic Directive stopped short of banning plastic filters outright, but it did mark them for reduction measures. Germany, on the other hand, will soon require plastic manufacturers to pay into a central clean-up fund. It is expected to bring in €450 million during the first year alone and impacts producers of drink containers, food wrappers, and yes, cigarette filters.
So, with the tide turning against cigarette filters, what’s next for the world’s number one plastic pollution problem?
![]()
Learn more about Greenbutts, creator of a certified 100% biodegradable, plant-based alternative to plastic cigarette filters.

Please enable JavaScript in your browser to complete this form.Subscribe to our free newsletter and get your mind blown on a daily basis: *Sign up
Related Topics: #cigarettes #Greenbutts #rivers #plastic waste #single use plastics #plastic pollution #ocean plastic
Click for Comments
var disqus_shortname = "visualcapitalist.disqus.com";
var disqus_title = "Mapped: The Colossal Cost of Plastic Pollution, By Country";
var disqus_url = "https://www.visualcapitalist.com/sp/mapped-the-colossal-cost-of-plastic-pollution-by-country/";
var disqus_identifier = "visualcapitalist.disqus.com-158712";
You may also like
-

Energy7 days ago
Life Cycle Emissions: EVs vs. Combustion Engine Vehicles
We look at carbon emissions of electric, hybrid, and combustion engine vehicles through an analysis of their life cycle emissions.
-

Green4 weeks ago
Ranked: The 20 Most Air-Polluted Cities on Earth
Using 2022 average PM2.5 concentrations, we’ve ranked the most polluted cities in the world according to IQAir.
-

Green3 months ago
Mapped: Air Pollution Levels Around the World in 2022
Exploring 2022 average air pollution levels around the world by PM2.5 concentration.
-

Environment3 months ago
Visualizing the Flow of Energy-Related CO2 Emissions in the U.S.
A look at the flow of energy-related CO2 emissions from the sources that generate energy to the sectors that use it.
-

Automotive4 months ago
Chart: Automakers’ Adoption of Fuel-Saving Technologies
See how 14 major automakers have adopted various fuel-saving technologies in this infographic based on EPA data.
-

Green4 months ago
Explainer: What to Know About the Ohio Train Derailment
A train transporting a number of potentially dangerous chemicals derailed near the Ohio–Pennsylvania border. This infographic explains what happened
Subscribe
Please enable JavaScript in your browser to complete this form.Join the 380,000+ subscribers who receive our daily email *Sign Up
The post Mapped: The Colossal Cost of Plastic Pollution, By Country appeared first on Visual Capitalist.