Subscribe to the Decarbonization Channel’s free mailing list for more like this
How to use: Click on the arrows on the side to toggle between years.
Mapped: Global Temperature Rise by Country (2022-2100P)
This was originally posted on the Decarbonization Channel. Subscribe to the free mailing list to be the first to see graphics related to decarbonization with a focus on the U.S. energy sector.
Many scientific authorities, such as the Intergovernmental Panel on Climate Change (IPCC), often discuss the need to limit planetary warming to 2°C above pre-industrial levels.
But did you know that this warming will not be evenly distributed throughout the globe due to factors such as geography, weather patterns, ocean currents, and the influence of human activities?
To discover the current and projected nuances of this uneven warming, these three maps created in partnership with the National Public Utilities Council visualize the global temperature rise by country, using new and updated data from Berkeley Earth.
Current State of Warming
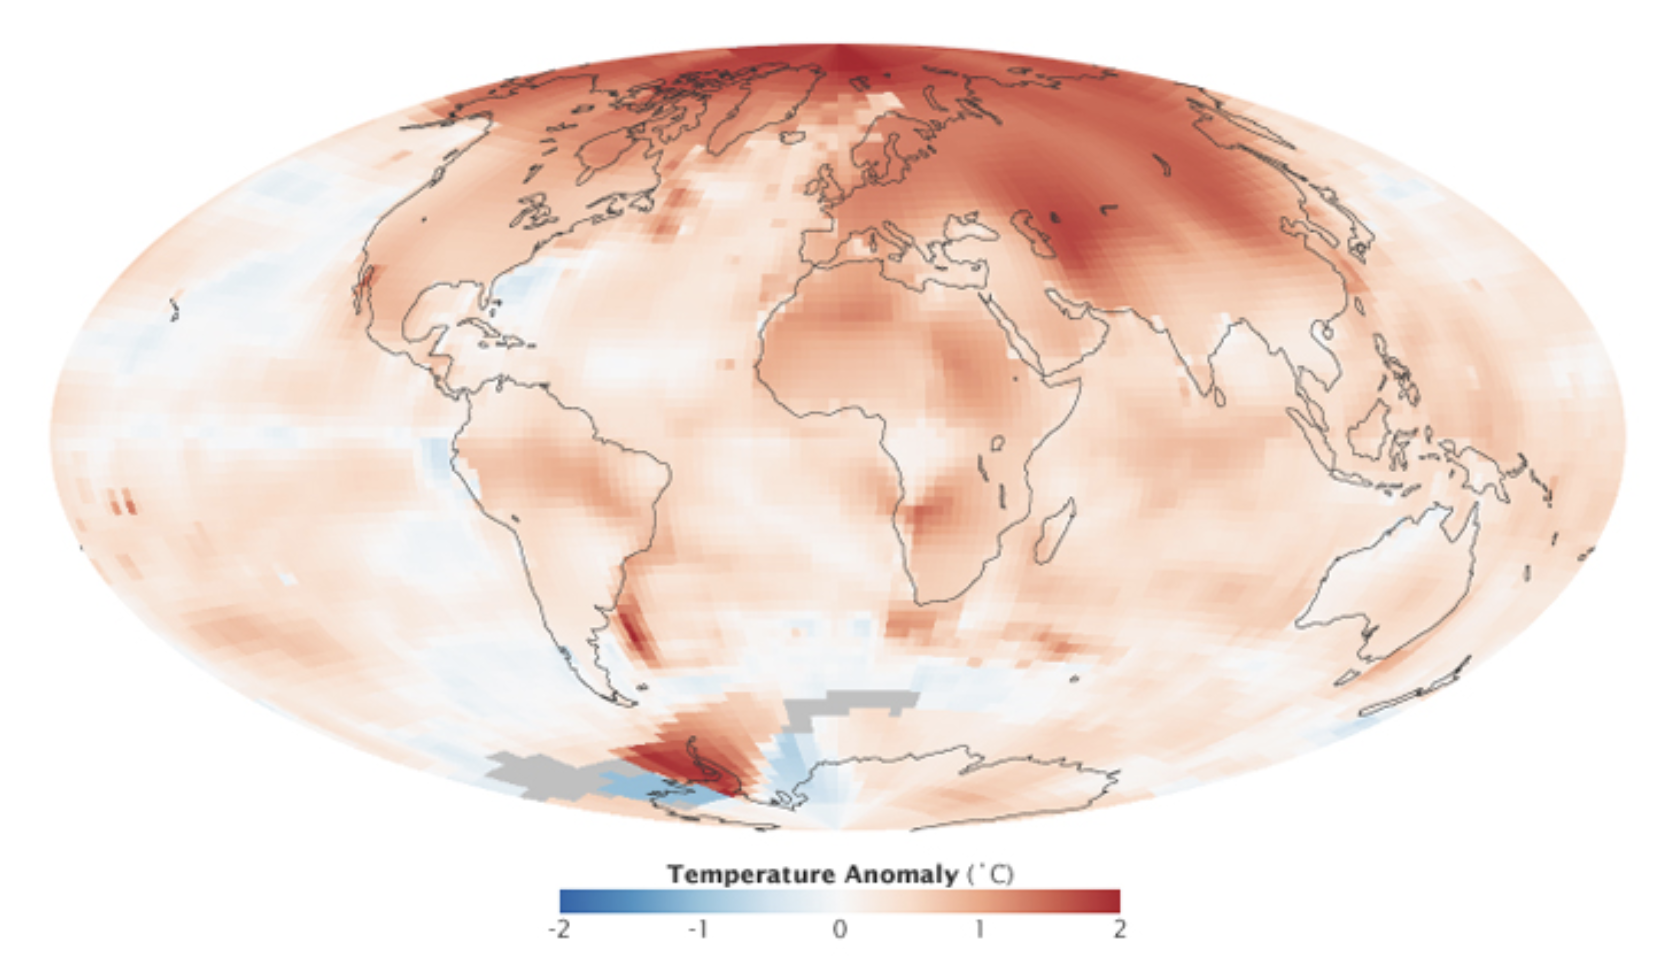
The three maps above visualize warming relative to each country’s average 1850-1900 temperatures.
Looking at warming in 2022, we see that average national warming (i.e. warming excluding oceans) is already 1.81°C above those numbers, with Mongolia warming the most (2.54°C) and Bangladesh warming the least (1.1°C).
As the map depicts, warming is generally more accelerated in the Global North. One of the reasons for this is Arctic amplification.
Arctic amplification refers to the disproportionate heating experienced in the Arctic compared to the rest of the planet. This amplification is fueled by multiple feedback loops, including decreased albedo as ice cover diminishes, leading to further absorption of heat and exacerbating the warming effect.
Arctic amplification. Source: NASA
Aside from modern-day observations, the effects of Arctic amplification are also clearly seen in climate models, where accelerated warming in countries such as Russia and Canada is seen through 2100.
Projected Warming in 2050 and 2100
Moving over to the second and third maps in the slides above, we discover country-level 2050 and 2100 warming projections.
These projections are based on the IPCC’s “middle-of-the-road” scenario, titled Shared Socioeconomic Pathway (SSP) 2-4.5. Out of the various established pathways, this one is the closest to expected emissions under current policies.
2050 Projections
Under the SSP2-4.5 scenario, average national warming is projected to be 2.75°C above average 1850-1900 temperatures in 2050. This includes Mongolia, with the most substantial warming of 3.76°C, and New Zealand, with the mildest warming of 2.02°C.
To put those temperatures into context, here are the risks that would likely accompany them, according to the IPCC’s latest assessment report.
- Extreme weather events will be more frequent and intense, including heavy precipitation and related flooding and cyclones.
- Nearly all ecosystems will face high risks of biodiversity loss, including terrestrial, freshwater, coastal and marine ecosystems.
- Accelerated sea level rise will threaten coastal cities, leading to mass displacement.
Let’s now take a look at 2100 projections, which would have significantly higher levels of risk unless fast and extreme mitigation and adaptation measures are implemented in the upcoming decades.
2100 Projections
2100 projections under the SSP2-4.5 scenario depict an average national warming of 3.80°C.
More than 55 countries across the globe are projected to have warming above 4°C in comparison to their 1850-1900 averages, and nearly 100 above 3.5°C.
Here is what those levels of warming would likely mean, according to the IPCC.
- 3-39% of terrestrial species will face very high risks of extinction.
- Water scarcity will considerably affect cities, farms, and hydro plants, and about 10% of the world’s land area will experience rises in both exceptionally high and exceptionally low river flows.
- Droughts, floods, and heatwaves will pose substantial threats to global food production and accessibility, eroding food security and impacting nutritional stability on a significant scale.
The post Mapped: Global Temperature Rise by Country (2022-2100P) appeared first on Visual Capitalist.