Click to view this graphic in a higher-resolution.
Mapping Cropland Cover Around the World
Over the last 50 years, the world’s human population worldwide has grown exponentially.
And this population explosion brought greater food production needs with it, through livestock breeding, cropland expansion, and other increases in land use.
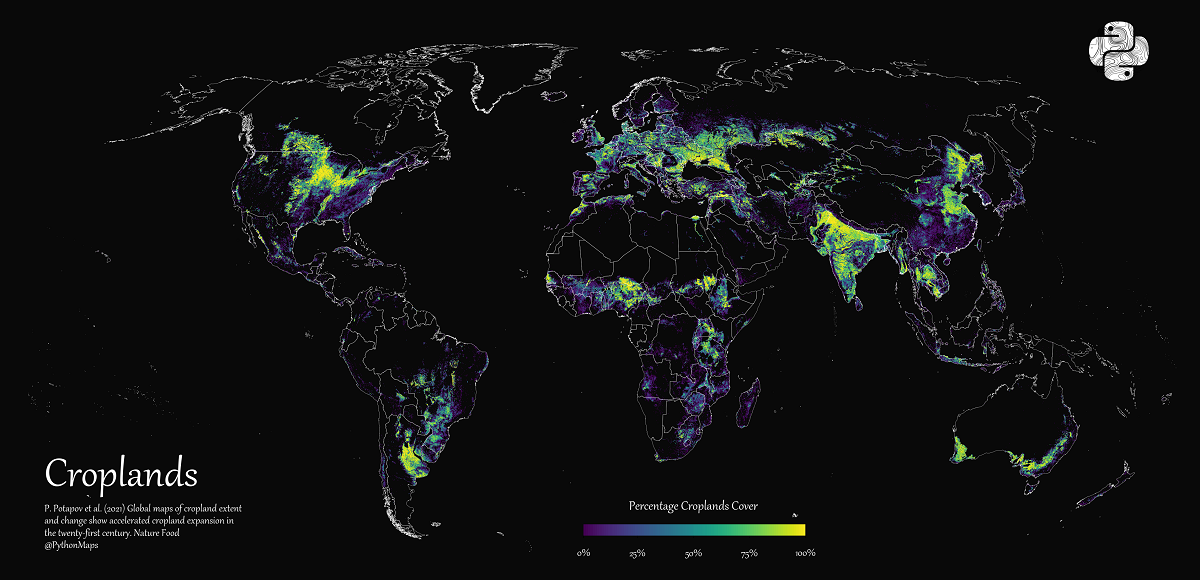
But how evenly is this land distributed globally? In this graphic, Adam Symington maps global croplands as of 2019, based on a 2021 scientific paper published in Nature by Peter Potapov et al.
The World’s Croplands
Croplands are defined as land areas used to cultivate herbaceous crops for human consumption, forage, and biofuel. At the start of the 21st century, the world’s croplands spread across 1,142 million hectares (Mha) of land.
Some of these croplands have since been abandoned, lost in natural disasters, or repurposed for housing, irrigation, and other infrastructural needs.
Despite this, the creation of new croplands increased overall cropland cover by around 9% and the net primary (crop) production by 25%.
Africa and South America Lead Croplands Expansion
In 2019, croplands occupied 1,244 Mha of land worldwide, with the largest regions being Europe and North Asia and Southwest Asia at around 20% of total cover each.
Interestingly, even though Africa (17%) and South America (9%) held lower percentages of the world’s croplands, they saw the highest expansion in croplands since 2000:
| Region | Cropland Area(Mha, 2000–03) | Cropland Area(Mha, 2016–19) | Change (Mha) |
|---|---|---|---|
| Africa | 155.1 | 208.3 | +53.2 |
| South America | 75.5 | 112.6 | +37.1 |
| Southwest Asia | 237.3 | 244.8 | +7.5 |
| Australia and New Zealand | 37.3 | 40.3 | +3.0 |
| North and Central America | 192.1 | 193.9 | +1.8 |
| Europe and North Asia | 252.3 | 253.2 | +0.9 |
| Southeast Asia | 192.7 | 191.1 | -1.6 |
| World | 1,142.3 | 1,244.2 | +101.9 |
South American nations including Argentina, Brazil, and Uruguay witnessed a steep rise in crop production between 2000 and 2007. Agricultural growth in the region can be attributed to both modern agricultural technology adoption and the production of globally demanded crops like soybeans.
A similar expansion in croplands within Sub-Saharan African countries at the start of the 21st century continues to persist today, as producers ramp up crop production for both exports and to try and alleviate food scarcity.
Much of these the world’s croplands were once forests, drylands, plains, and lowlands. And this loss in green cover is clearly seen across Africa, South America, and parts of Asia.
However, some regions have also witnessed tree plantations, orchards, and aquaculture replacing former croplands. One such example is Vietnam’s Mekong Delta, and indeed Southeast Asia was the only region that saw an overall decline in cropland cover from 2000 to 2019.
Moving Towards Sustainable Agriculture
The expansion of croplands has also come at a cost, destroying large stretches of forest cover, and further contributing to wildlife fragmentation and greenhouse gas emissions.
However, hope for more sustainable development is not lost. Nations are finding ways to improve agricultural productivity in ways that free up land.
As global demand for food continues to increase, agricultural expansion and intensification seem imminent. But innovation, and a changing climate, may elevate alternative solutions in the future.
The post Mapped: How Much of the World is Covered by Croplands? appeared first on Visual Capitalist.