
Published
56 mins ago
on
September 28, 2023
| 31 views
-->
By
Dorothy Neufeld
Graphics & Design
- Alejandra Dander
The following content is sponsored by MSCI


Visualized: An Investor’s Carbon Footprint, by Sector
In the quest for a sustainable future, investors can play a crucial role in shaping our planet’s destiny.
Understanding the carbon emissions in different sectors is a key way to make environmentally and financially conscious decisions and help make a positive impact on the planet.
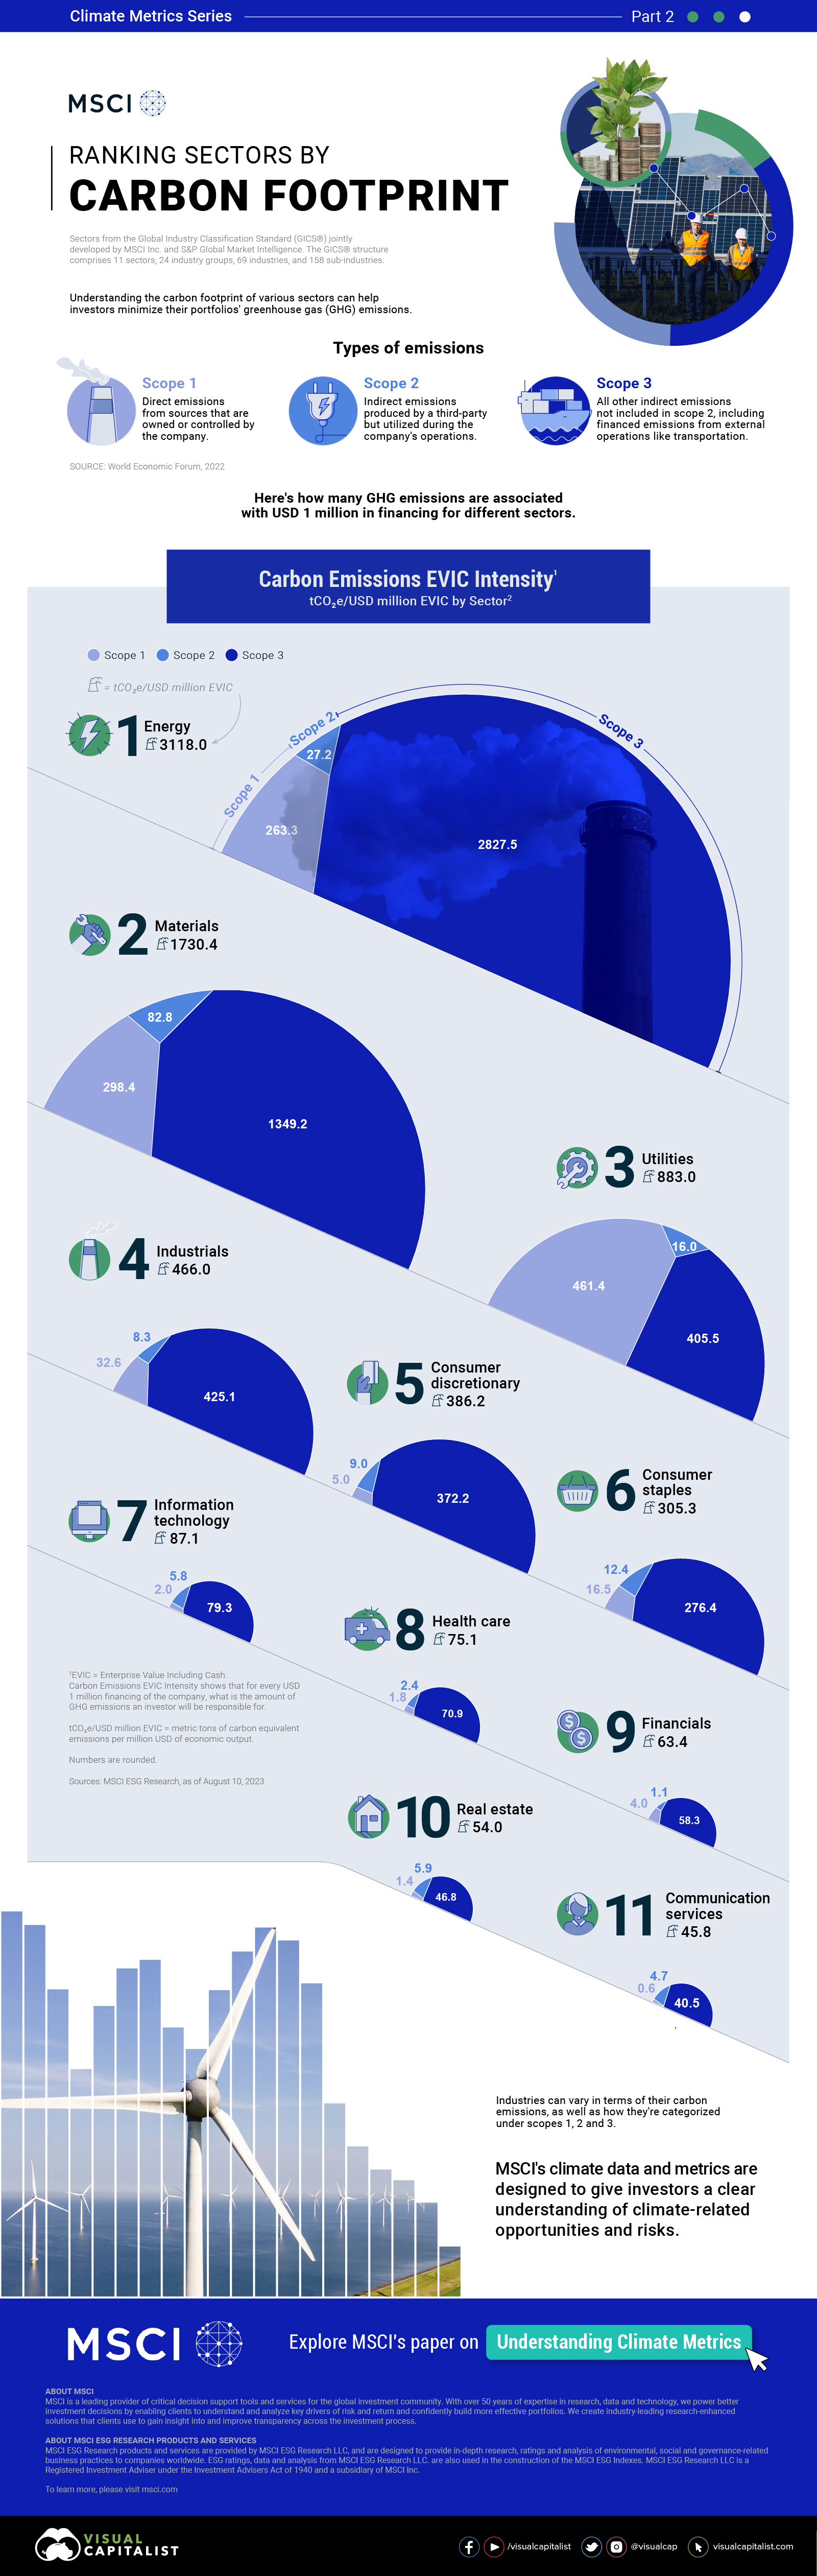
This infographic, sponsored by MSCI, looks at carbon emissions by sector.
Types of Carbon Emissions
Unsurprisingly, industries heavily reliant on fossil fuels and energy-intensive processes, like energy, materials, and industrials, have significant carbon footprints. In contrast, service-based and technology industries are traditionally less carbon-intensive.
To get an accurate picture of a sector/industry’s carbon footprint, it’s important to look up and down their value chain. Here is how policymakers categorize carbon emissions:
- Scope 1: Generated directly by the organization and within its control e.g., on-site fuel combustion and internal industrial processes.
- Scope 2: Indirect emissions from energy use, such as purchased electricity, heat, or cooling.
- Scope 3: Indirect emissions, but different from Scope 2 emissions. These are emissions that the company does not directly control such as the emissions produced from a supplier or emissions generated from the use of its sold product.
Only looking at all three scopes of emissions can we arrive at a complete picture of a sector’s carbon footprint.
Volume of Carbon Emissions, by Sector
The following table breaks down the greenhouse gas emissions for each sector by scope. A sector’s carbon footprint is expressed in metric tons of CO2 equivalent for every $1 million in financing.
In other words, here’s how much of a climate impact a one million dollar investment has in each of the following sectors.
The total figure represents the weighted average carbon emissions of each sector’s constituents as of August 10, 2023:
| Sector | Scope 1 | Scope 2 | Scope 3 | Total |
|---|---|---|---|---|
| Energy | 263.3 | 27.2 | 2827.5 | 3118.0 |
| Materials | 298.4 | 82.8 | 1349.2 | 1730.4 |
| Utilities | 461.4 | 16.0 | 405.5 | 883.0 |
| Industrials | 32.6 | 8.3 | 425.1 | 466.0 |
| Consumerdiscretionary | 5.0 | 9.0 | 372.2 | 386.2 |
| Consumer staples | 16.5 | 12.4 | 276.4 | 305.3 |
| Informationtechnology | 2.0 | 5.8 | 79.3 | 87.1 |
| Health care | 1.8 | 2.4 | 70.9 | 75.1 |
| Financials | 4.0 | 1.1 | 58.3 | 63.4 |
| Real estate | 1.4 | 5.9 | 46.8 | 54.0 |
| Communicationservices | 0.6 | 4.7 | 40.5 | 45.8 |
Represented by tCO₂e/USD million EVIC. EVIC is the enterprise value including cash.
Understanding carbon footprint profiles can help investors evaluate the risks faced by carbon-intensive industries, such as future regulations and reputational challenges.
MSCI’s climate metrics empower investors to make responsible investments and drive meaningful change.
![]()
Download MSCI’s Climate Metrics Report.

Please enable JavaScript in your browser to complete this form.Enjoying the data visualization above? *Subscribe
Related Topics: #carbon emissions by sector #carbon footprint #msci #scopes of emissions
Click for Comments
var disqus_shortname = "visualcapitalist.disqus.com";
var disqus_title = "Visualized: An Investor’s Carbon Footprint, by Sector";
var disqus_url = "https://www.visualcapitalist.com/sp/visualized-an-investors-carbon-footprint-by-sector/";
var disqus_identifier = "visualcapitalist.disqus.com-161233";
You may also like
-
Environment1 month ago
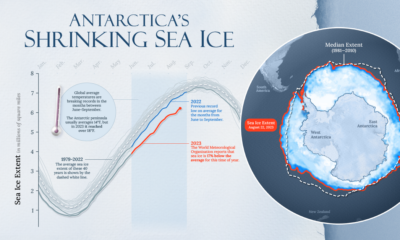
Tracking Antarctica Sea Ice Loss in 2023
Antarctica’s ice extent has reached record lows. This visual details and maps Antarctica sea ice loss over the last two years.
-

Environment1 month ago
The Anthropocene: A New Epoch in the Earth’s History
We visualize Earth’s history through the geological timeline to reveal the planet’s many epochs, including the Anthropocene.
-

Green2 months ago
Visualizing the Global Population by Water Security Levels
This chart highlights the different countries, and the number of people, facing water security issues around the world.
-
Green2 months ago
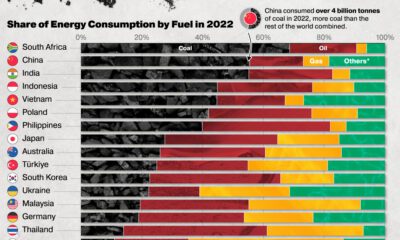
Which Countries Are Most Reliant on Coal?
Global consumption of coal surpassed 8 billion tonnes per year for the first time in 2022. Here are the countries using the most coal.
-

Environment3 months ago
Hotter Than Ever: 2023 Sets New Global Temperature Records
Four days straight in July 2023 set or equaled global temperature records on average.
-

Energy3 months ago
Life Cycle Emissions: EVs vs. Combustion Engine Vehicles
We look at carbon emissions of electric, hybrid, and combustion engine vehicles through an analysis of their life cycle emissions.
Subscribe
Please enable JavaScript in your browser to complete this form.Join the 375,000+ subscribers who receive our daily email *Sign Up
The post Visualized: An Investor’s Carbon Footprint, by Sector appeared first on Visual Capitalist.