![]()
See this visualization first on the Voronoi app.
Visualizing Racial Diversity in America’s 10 Largest States
This was originally posted on our Voronoi app. Download the app for free on iOS or Android and discover incredible data-driven charts from a variety of trusted sources.
Over the last decade, America has become increasingly more diverse as demographic patterns shift across the population.
With over 39 million people, California is not only the most populous state, but one of the most diverse in the country.
This graphic shows the racial diversity of the 10 biggest states by population, based on data from the U.S. Census.
How Diverse Are America’s Most Populous States?
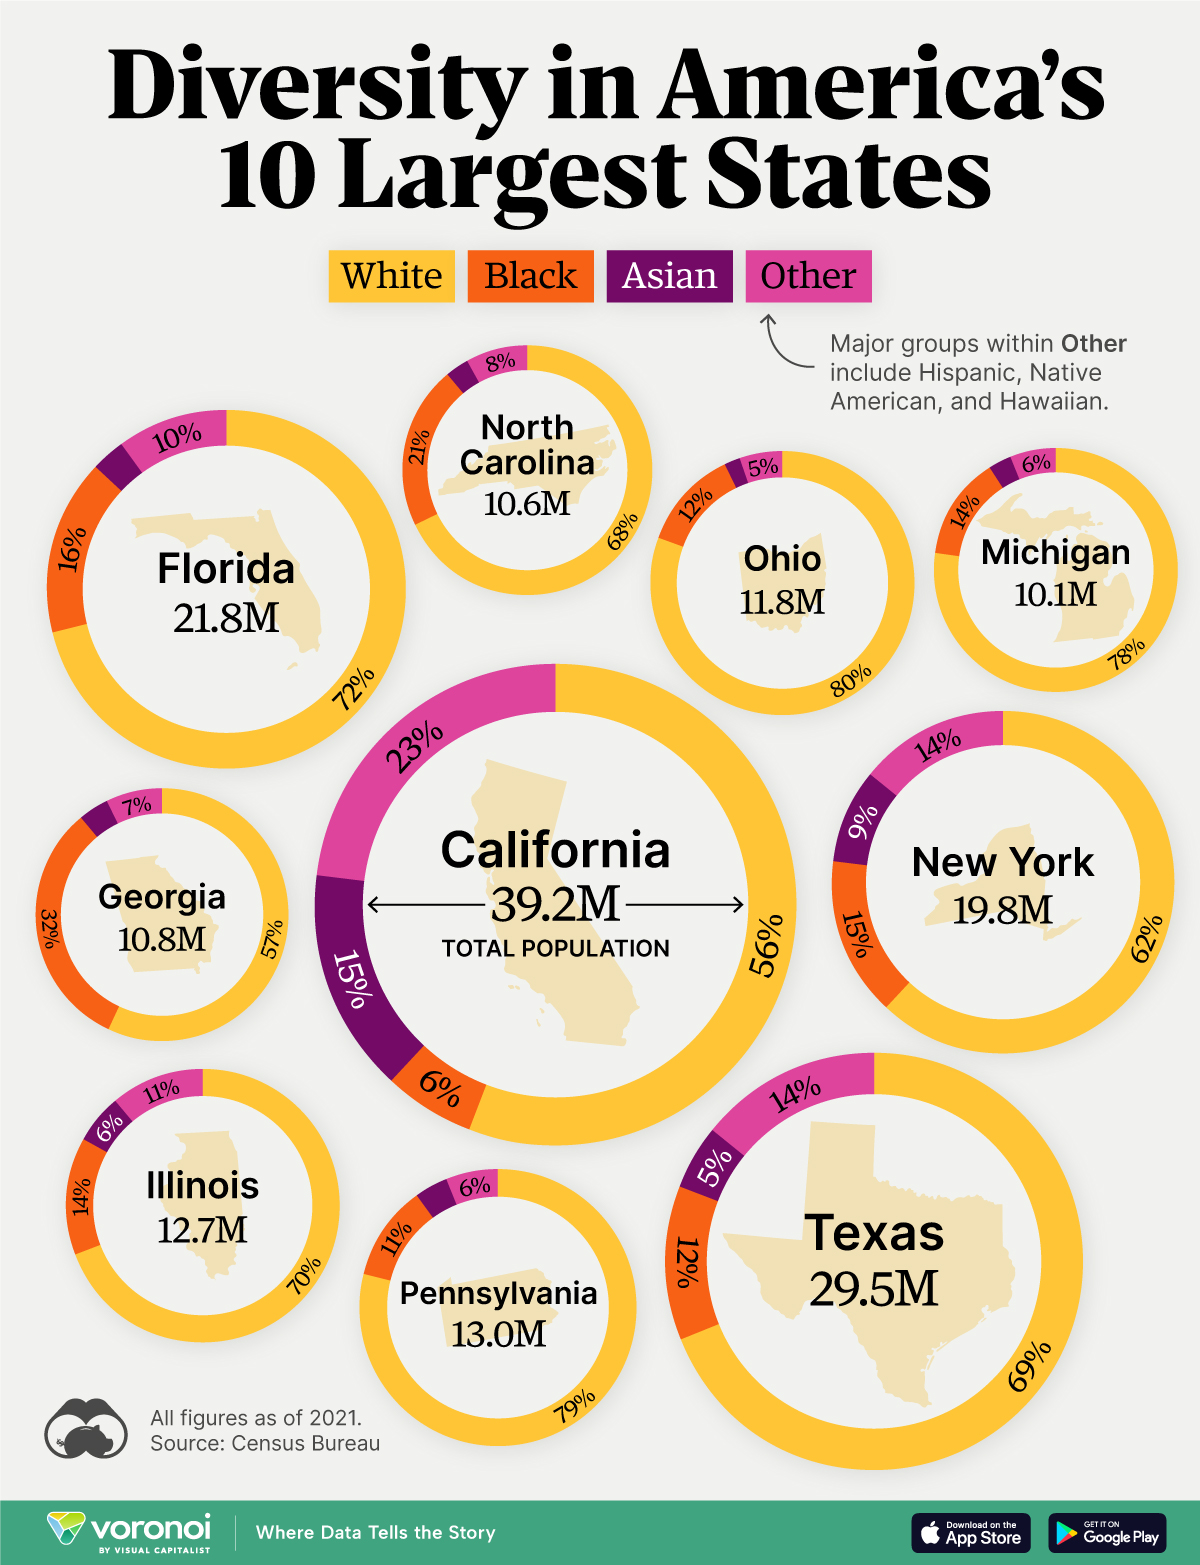
Here is the racial breakdown of the 10 largest U.S. states:
| State | White (%) | Black (%) | Asian (%) | Other (%) |
|---|---|---|---|---|
| California | 56 | 6 | 15 | 23 |
| Texas | 69 | 12 | 5 | 14 |
| Florida | 72 | 16 | 3 | 10 |
| New York | 62 | 15 | 9 | 14 |
| Pennsylvania | 79 | 11 | 4 | 6 |
| Illinois | 70 | 14 | 6 | 11 |
| Ohio | 80 | 12 | 2 | 5 |
| Georgia | 57 | 32 | 4 | 7 |
| North Carolina | 68 | 21 | 3 | 8 |
| Michigan | 78 | 14 | 3 | 6 |
As the table above shows, California has the highest proportion of Asian Americans across the top 10 states, comprising 15% of the population.
Meanwhile, Georgia’s ethnic makeup includes 32% of Black Americans, the highest across the most populous states. As diversity has risen over the last decade, it has significantly influenced politics at both the state and national level. The state voted Republican for every presidential election from 1996-2016, but flipped blue in 2020.
With 80% of the population being White Americans, Ohio has the highest share across the biggest states. While diversity has increased since 2010, it has been seen mostly in urban and suburban districts while diversity has stagnated in rural areas.
Overall, 24% of rural areas in the U.S. are made up of non-White Americans, rising by a median rate of 3.5% across counties since 2010. While this debunks the myth that “rural” is synonymous with “white”, racial diversity across rural areas falls below the national average of 42% of the population being people of color.
Beyond the top 10 states, ethnic diversity is the highest in Hawaii, Nevada, and Maryland.
The post Visualizing Racial Diversity in America’s 10 Largest States appeared first on Visual Capitalist.