
Published
43 mins ago
on
August 8, 2023
| 53 views
-->
By
Alan Kennedy
Graphics & Design
- Sabrina Fortin
The following content is sponsored by Lloyd's Register Foundation


Visualizing Harassment and Violence in the Global Workplace
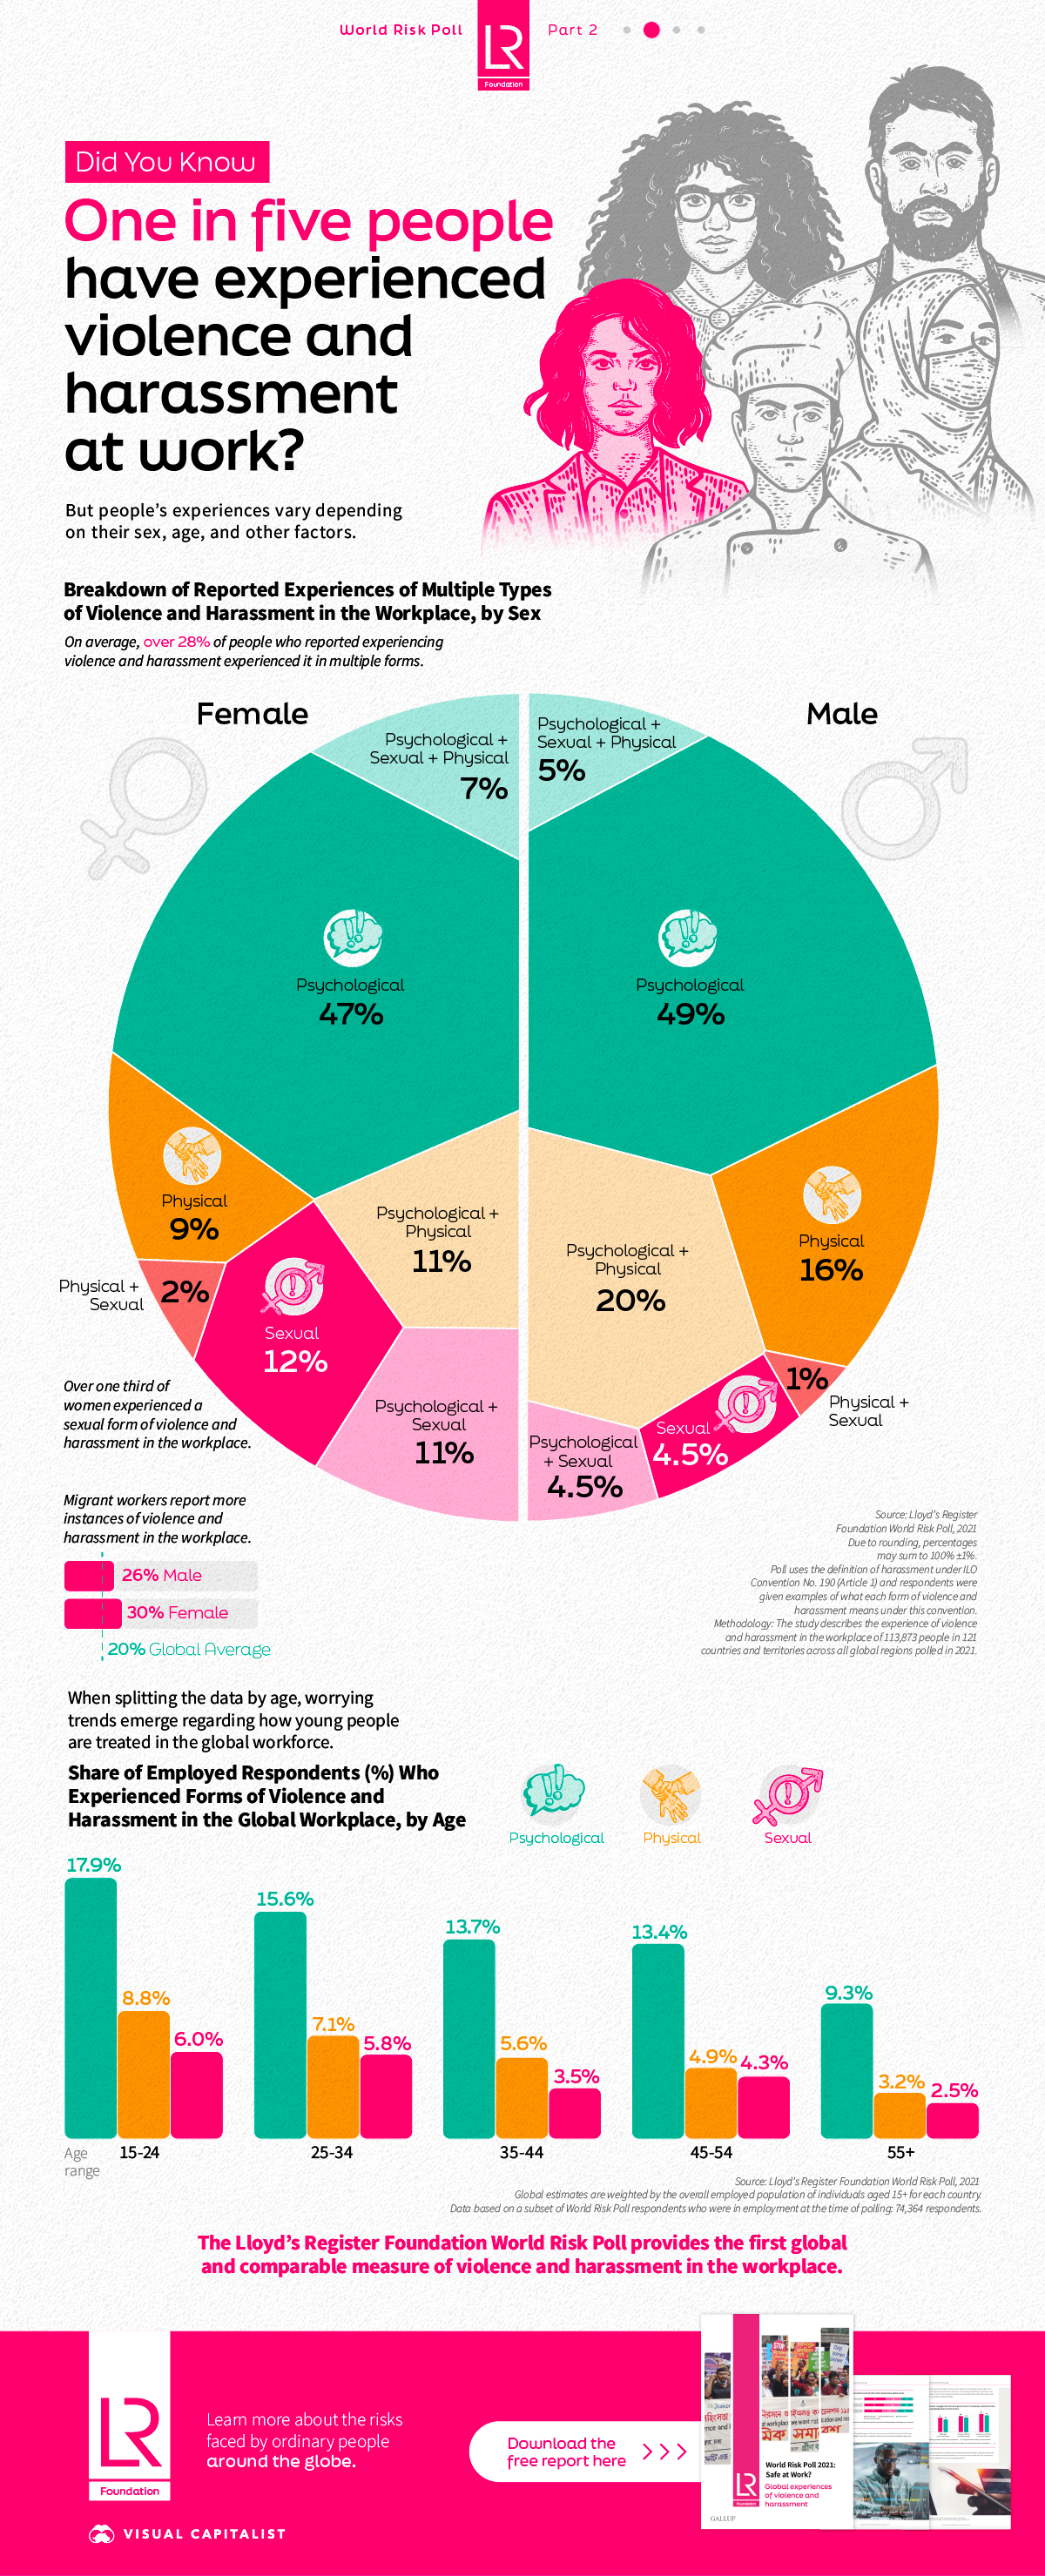
Did you know that one in five people have experienced violence and harassment in the workplace at least once?
In this graphic sponsored by Lloyd’s Register Foundation, we showcase the findings from the World Risk Poll 2021: Safe at Work? report and uncover some uncomfortable truths about workplaces across the world.
The Context
There is an urgent need for comprehensive and reliable data on the nature and scale of workplace harassment to help policymakers target their efforts.
To address this need, the Lloyd’s Register Foundation partnered with Gallup to produce the World Risk Poll—the first global and comparable survey on violence and harassment in the workplace from respondents across 121 countries.One extremely important note to mention is that all data is based on incidents that were reported and therefore may be an underestimation of actual cases of physical, sexual, and psychological harassment in the workplace.
The Findings and What They Mean
The study found that a concerning number of people reported harassment and violence at work and that experiences varied by gender.
The data shows the reported instances of multiple types of violence and harassment in the workplace that were experienced one or more times.
Take for example the first row of the table below. It is saying that 49% of men who reported at least one instance of violence reported it as psychological abuse alone, compared to 20% of men who experienced a combination of both psychological and physical abuse one or more times.
| Harassment Form | Female (%) | Male (%) |
|---|---|---|
| Psychological | 47% | 49% |
| Physical | 9% | 16% |
| Sexual | 12% | 4.5% |
| Psychological + Physical | 11% | 20% |
| Psychological + Sexual | 11% | 4.5% |
| Physical + Sexual | 2% | 1% |
| Physical + Sexual + Psychological | 7% | 5% |
Notably, women’s experiences had a sexual element in 32% of cases, while just 16% of men’s experiences had this element.
Moreover, foreign-born women and men reported higher instances of violence and harassment in the workplace, with 30% of foreign-born women and 26% of foreign-born men experiencing some for of workplace abuse—surpassing the global average of 20%.
Examining statistics related to age in the global workforce also reveals concerning trends. Among those aged under 24 years old, over 33% experienced psychological abuse in the workplace.
| Age | Psychological (%) | Physical (%) | Sexual (%) | Total (%) |
|---|---|---|---|---|
| 15-24 | 17.9% | 8.8% | 6% | 32.7% |
| 25-34 | 15.6% | 7.1% | 5.8% | 28.5% |
| 35-44 | 13.7% | 5.6% | 3.5% | 22.8% |
| 45-54 | 13.4% | 4.9% | 4.3% | 22.6% |
| 55+ | 9.3% | 3.2% | 2.5% | 15% |
An Urgent Need for Collective Action
The statistics presented in the report show that workplace harassment and violence is an issue that impacts a significant portion of the global workforce, with migrant workers and young people being the most at risk.
In part three of this series, we’ll explore the World Risk Poll 2021: A Resilient World? And learn about the types of financial difficulties people face all over the globe.
![]()
Download the free World Risk Poll: Safe at Work? report now.

Please enable JavaScript in your browser to complete this form.Enjoying the data visualization above? *Subscribe
Related Topics: #work #lloyds register foundation #LRF #World Risk Poll 2021 #harassment #violence #world #global #workplace
Click for Comments
var disqus_shortname = "visualcapitalist.disqus.com";
var disqus_title = "World Risk Poll: Visualizing Harassment and Violence in the Workplace";
var disqus_url = "https://www.visualcapitalist.com/sp/workplace-violence-harassment/";
var disqus_identifier = "visualcapitalist.disqus.com-159989";
You may also like
-
Economy5 days ago
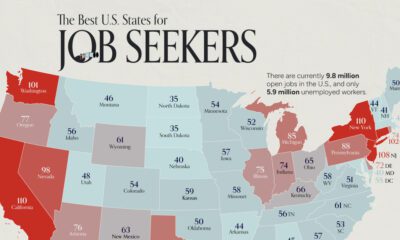
Mapped: Unemployed Workers vs. Job Openings, by U.S. State
On average, there are 75 workers available for every 100 job openings across the country. Here’s how it varies by state.
-
Markets3 weeks ago
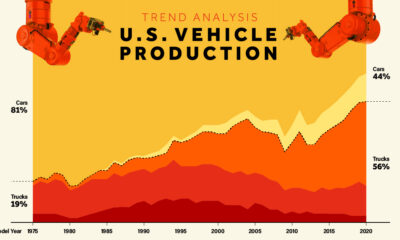
How U.S. Vehicle Production Has Shifted Over 45 Years
Visualize how U.S. vehicle production has shifted dramatically from cars to trucks, and especially to SUVs, since 1975.
-
Misc3 weeks ago
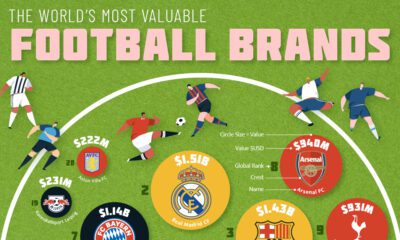
Ranked: The World’s Most Valuable Football Club Brands
Which clubs, aside from competing on the pitch, also compete as football brands? How much are the most valuable club brands worth?
-

Politics3 weeks ago
How Do Chinese Citizens Feel About Other Countries?
What is the Chinese public’s view of world powers? This visual breaks down Chinese sentiment towards other countries.
-

Cities4 weeks ago
Mapped: The Safest Cities in the U.S.
How safe is small town America? This map reveals the safest cities in the U.S. in terms of the total crime rate per every 1,000 residents.
-

Maps4 weeks ago
Mapped: World’s Top 40 Largest Military Budgets
War in Europe has caused Ukraine’s military spend to jump up by 640%. How do the world’s largest military budgets compare?
Subscribe
Please enable JavaScript in your browser to complete this form.Join the 375,000+ subscribers who receive our daily email *Sign Up
The post World Risk Poll: Visualizing Harassment and Violence in the Workplace appeared first on Visual Capitalist.