Ranked: Top 15 Countries by Military Budgets in 2025
The Best Visualizations of June 2025 on the Voronoi App

Just over a year ago, we launched Voronoi, our free new data discovery app.
Believe it or not, there are already more data-driven visuals on Voronoi than on Visual Capitalist (which has been around for 13 years!).
Every day there’s something new on Voronoi to see. And in aggregate, there are roughly 5,000 data stories to explore on the platform from 150+ world-class creators.
Explore Voronoi
Let’s see what captivated users in June.
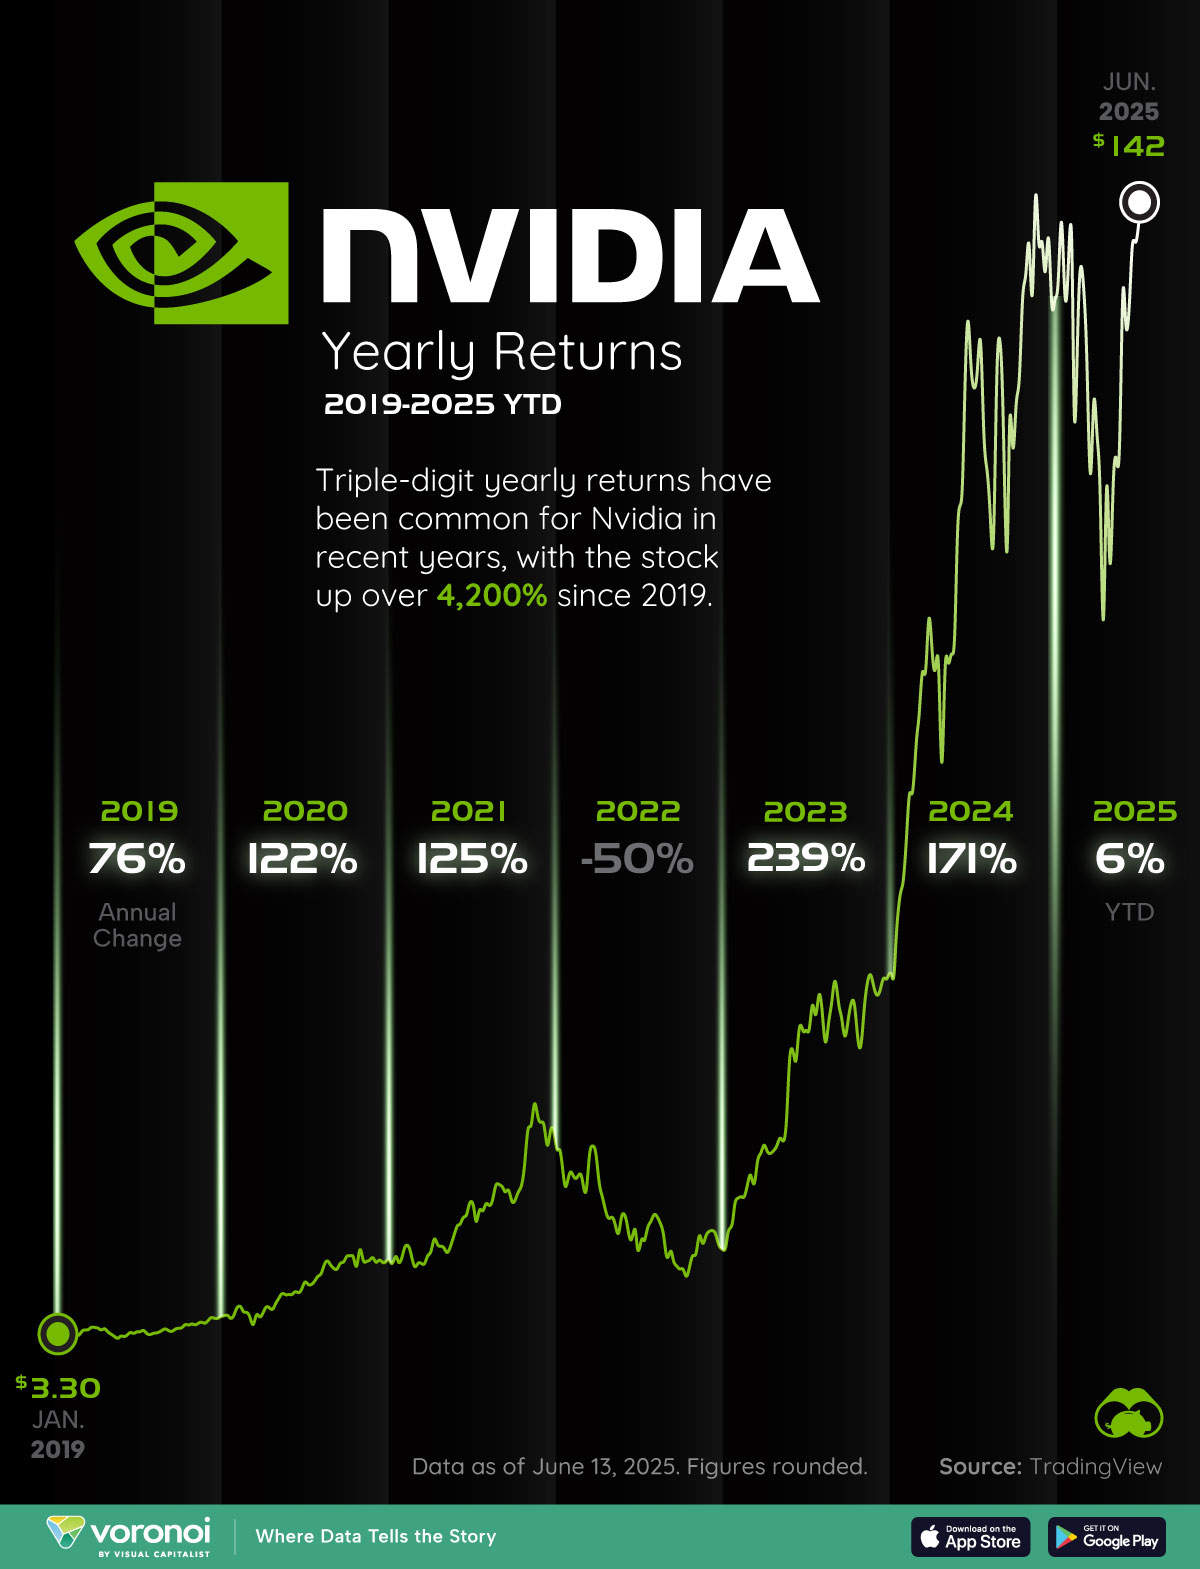
Chart: Nvidia’s Stock Performance (2019-2025)
![]()
See this visualization first on the Voronoi app.
Use This Visualization
Charting Nvidia’s Stock Performance Since 2019
This was originally posted on our Voronoi app. Download the app for free on iOS or Android and discover incredible data-driven charts from a variety of trusted sources.
Key Takeaways
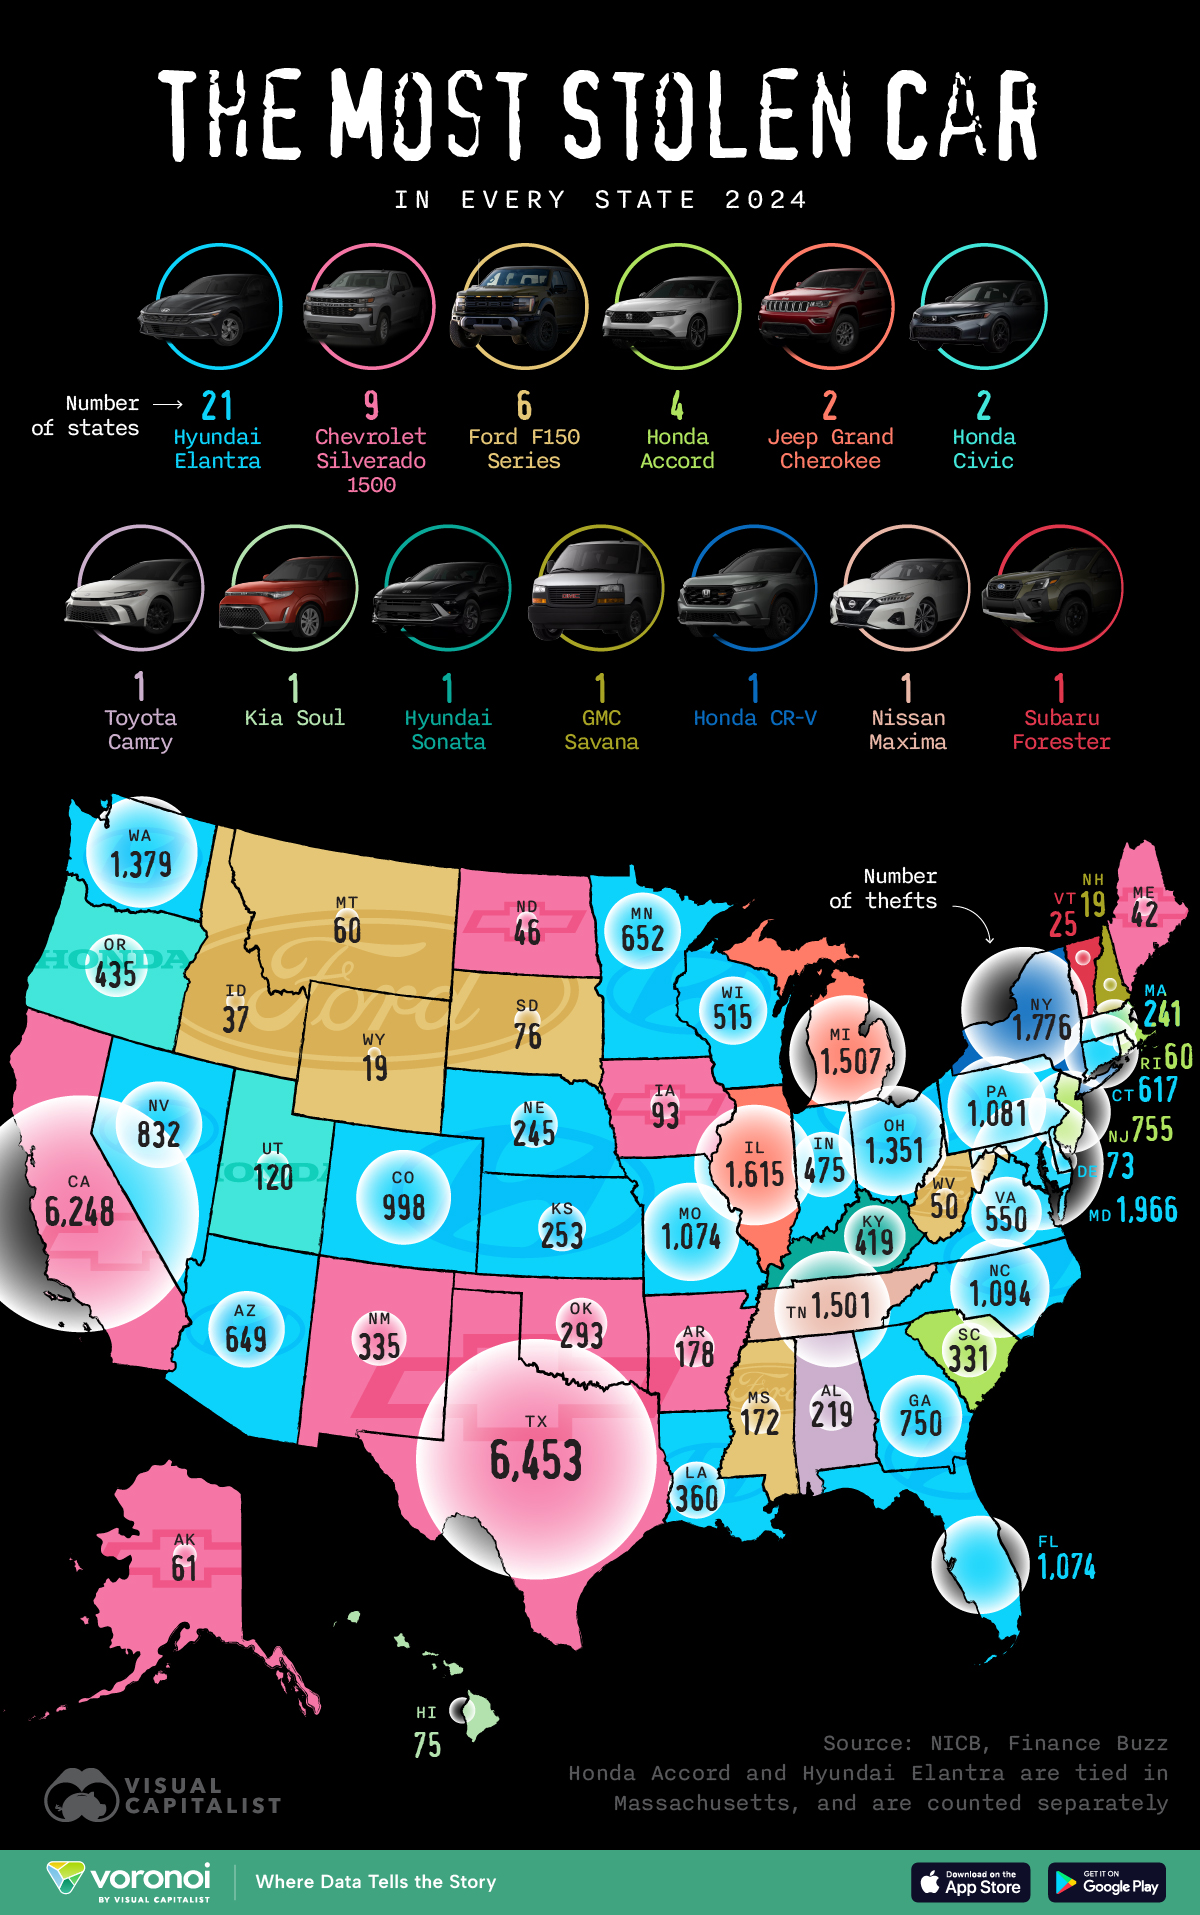
Mapped: The Most Stolen Car in Every U.S. State
![]()
See this visualization first on the Voronoi app.
Use This Visualization
Mapped: The Most Stolen Car in Every U.S. State
This was originally posted on our Voronoi app. Download the app for free on iOS or Android and discover incredible data-driven charts from a variety of trusted sources.
Key Takeaways