Visualizing The Smoking Population of Countries
Visualizing The Smoking Population of Countries
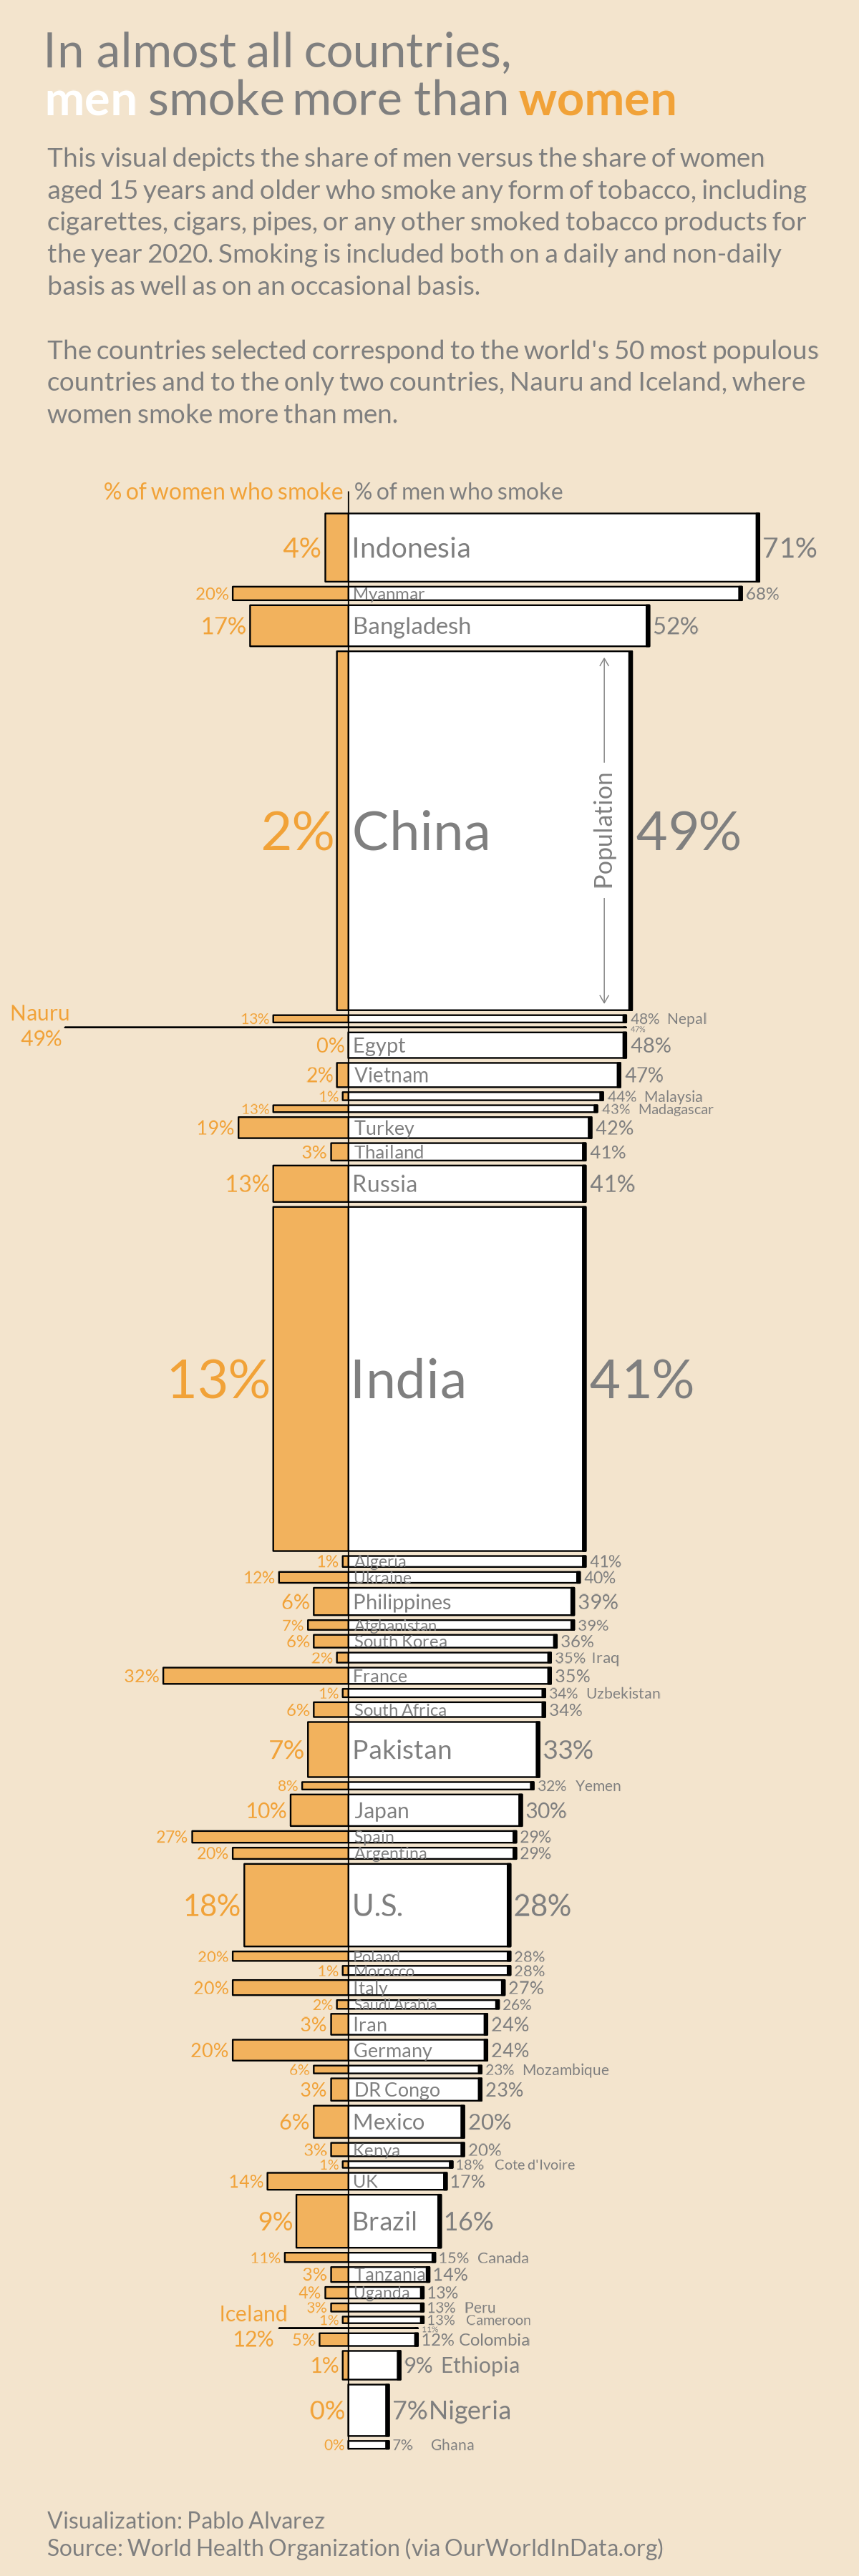
According to Our World in Data, about one-in-four adults around the world smoke tobacco—at least on an occasional basis. And in many countries, a majority of these smokers are men.