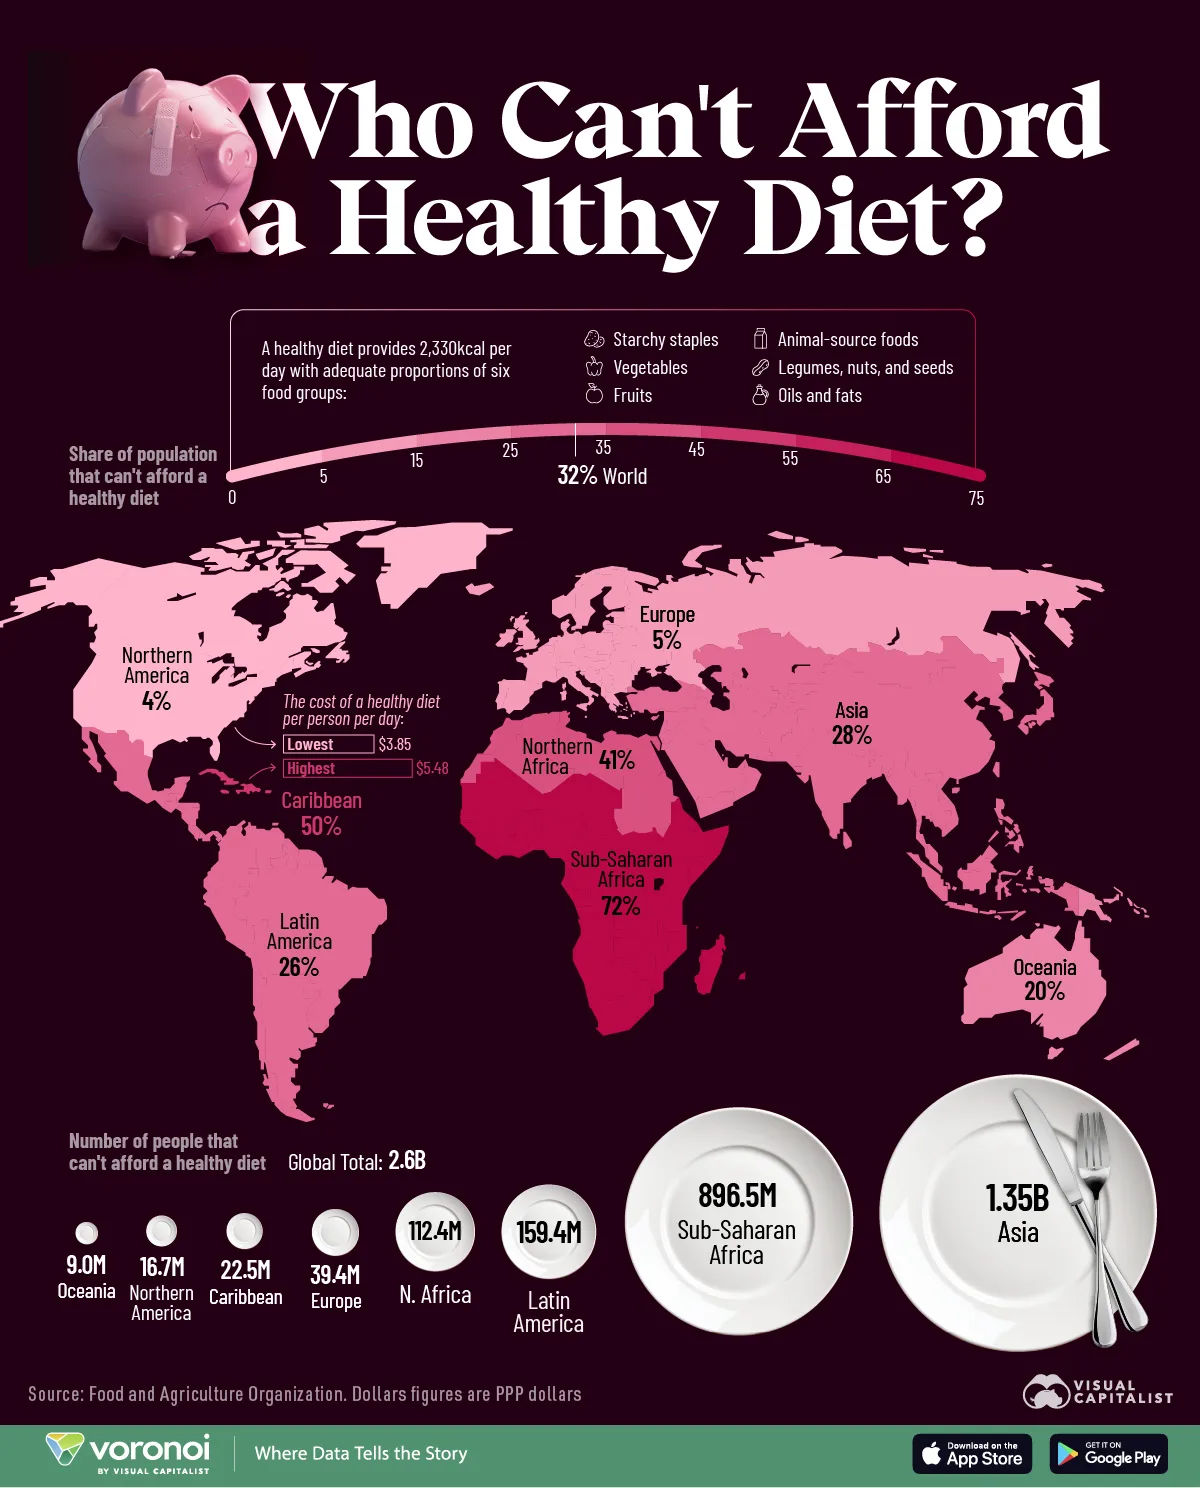
Mapped: Population that Can’t Afford a Healthy Diet by Region
![]()
See this visualization first on the Voronoi app.
Use This Visualization
Mapped: Population that Can’t Afford a Healthy Diet by Region
This was originally posted on our Voronoi app. Download the app for free on iOS or Android and discover incredible data-driven charts from a variety of trusted sources.
Key Takeaways