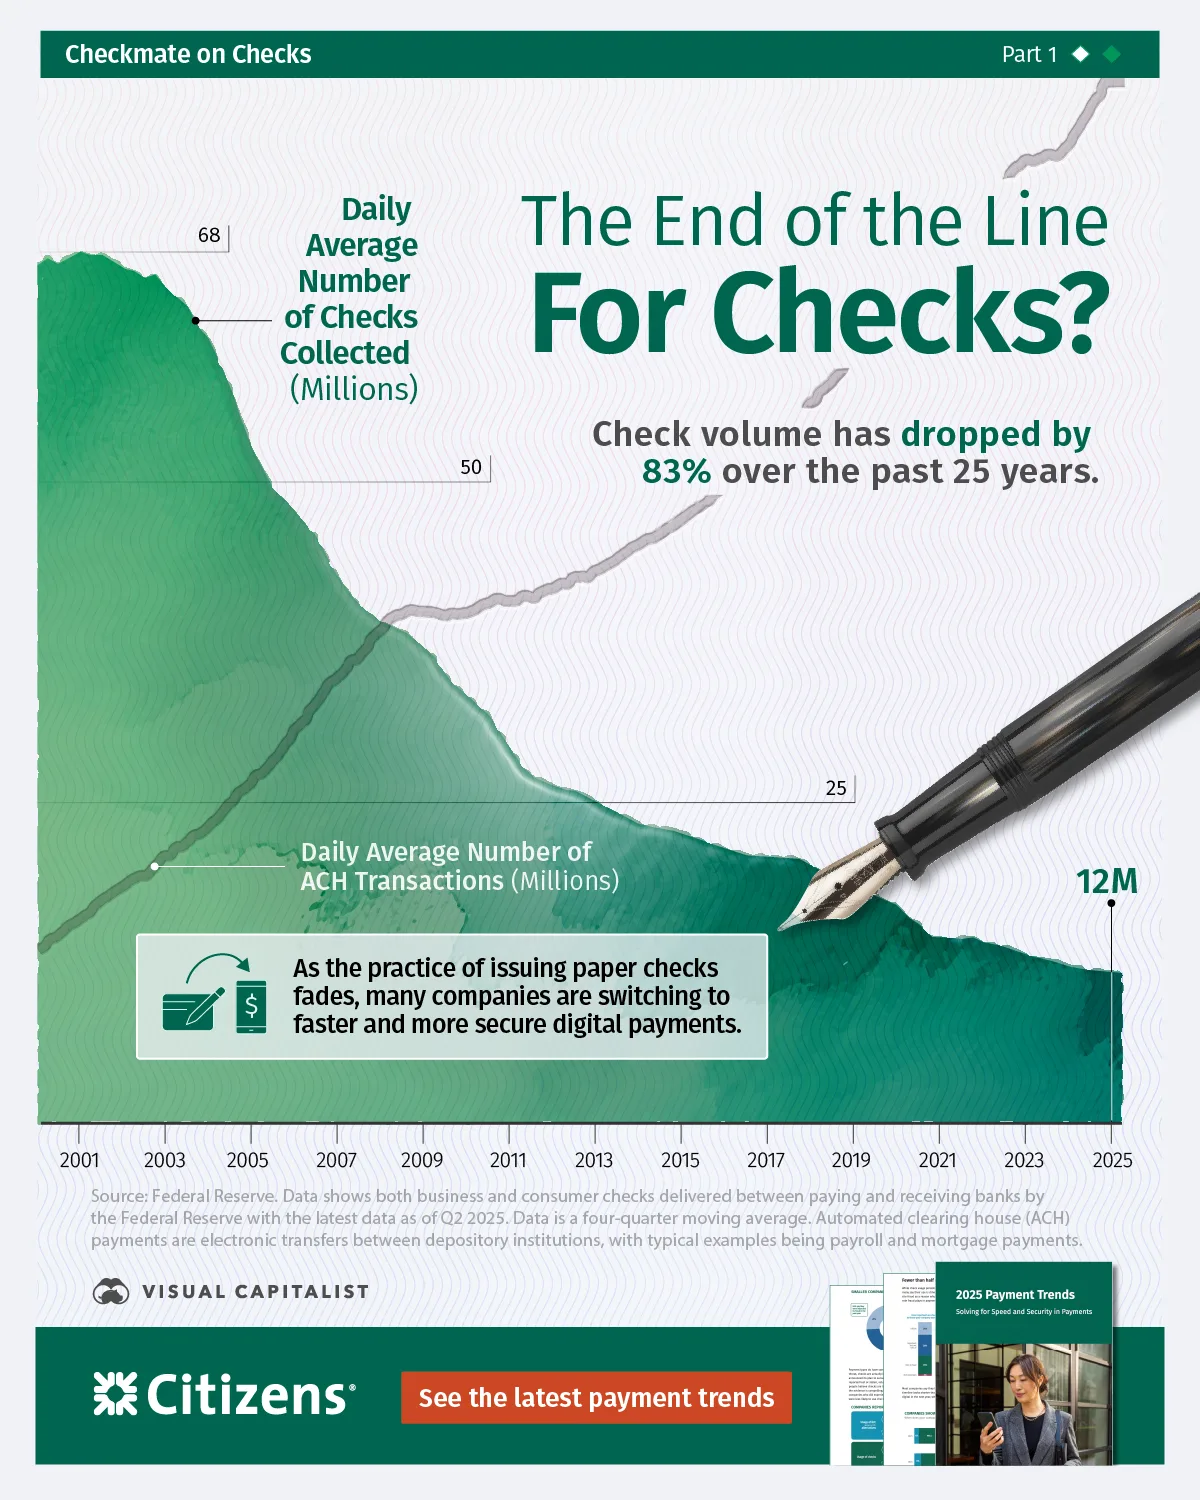
Charted: The End of the Line For Checks?

Published
1 hour ago
on
September 26, 2025
| 1,461 views
-->
By
Jenna Ross
Article & Editing
- Ryan Bellefontaine
Graphics & Design

Published
1 hour ago
on
September 26, 2025
| 1,461 views
-->
By
Jenna Ross
Article & Editing
Graphics & Design
![]()
See more visualizations like this on the Voronoi app.

Use This Visualization
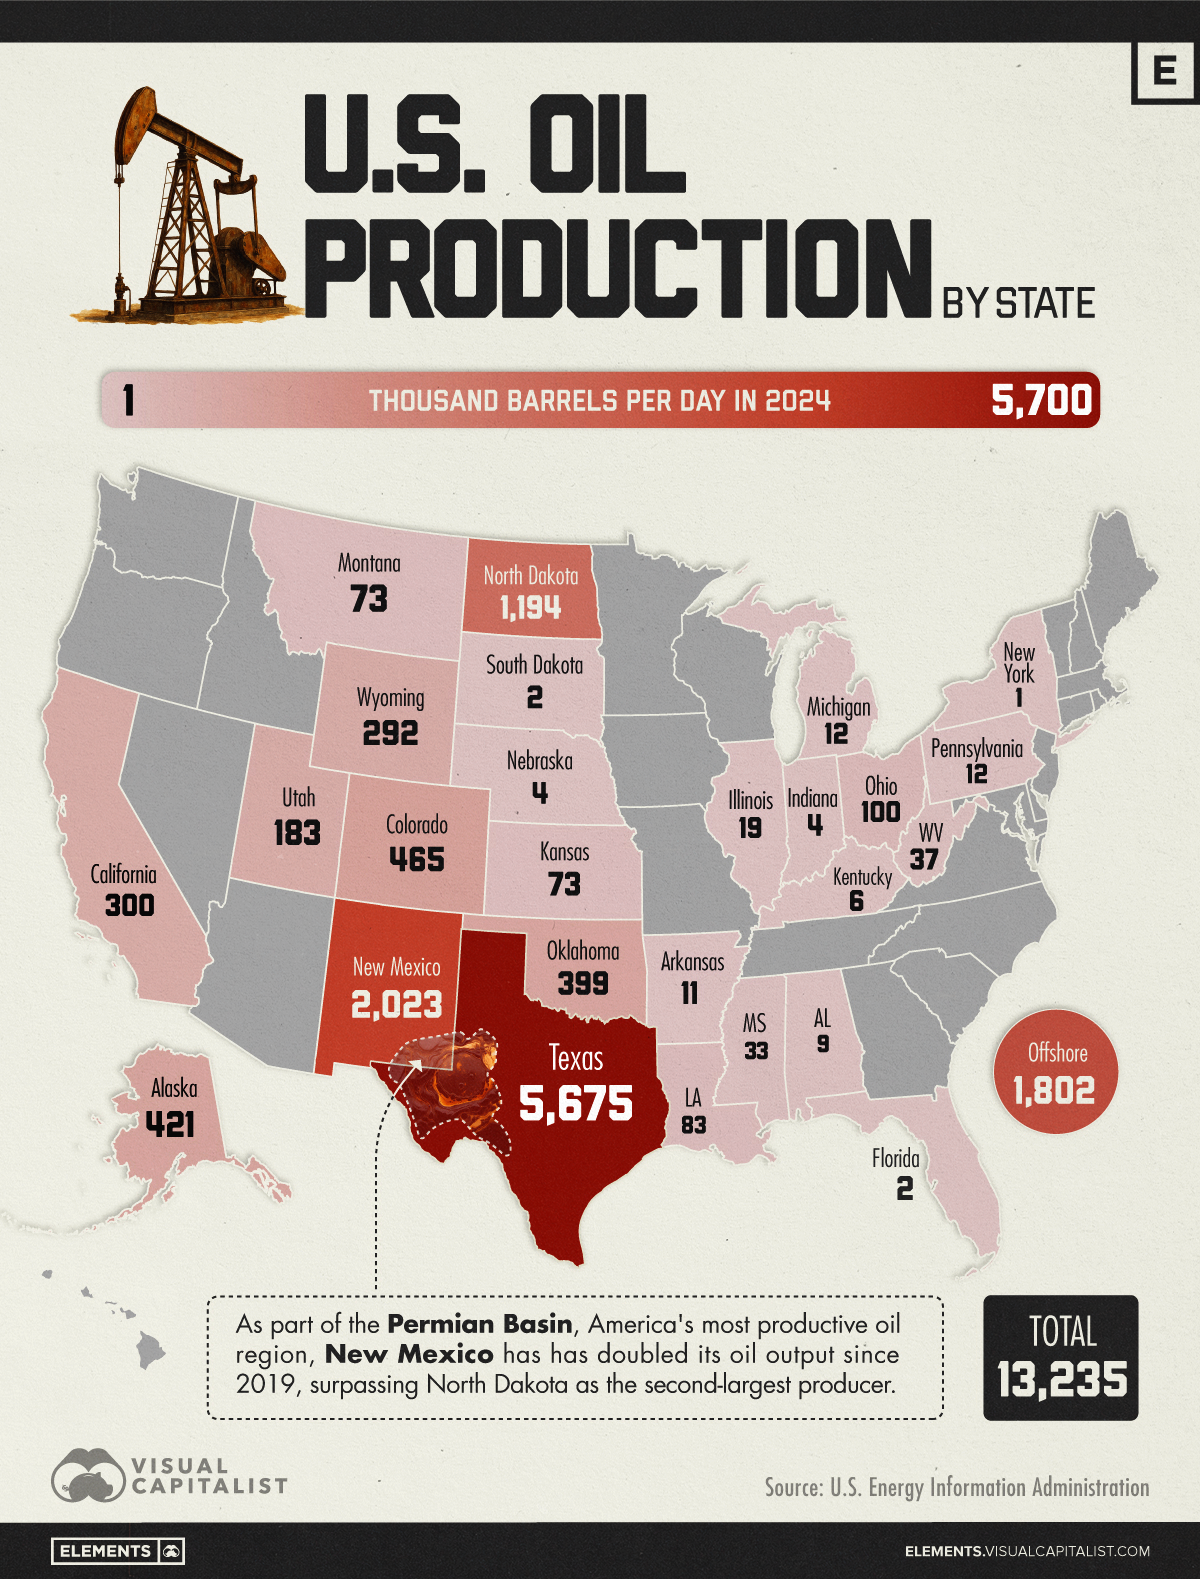
Mapped: U.S. Oil Production by State
See visuals like this from many other data creators on our Voronoi app. Download it for free on iOS or Android and discover incredible data-driven charts from a variety of trusted sources.

Published
30 minutes ago
on
September 25, 2025
| 7 views
-->
By
Julia Wendling
Graphics & Design

Published
1 hour ago
on
September 24, 2025
| 32 views
-->
By
Alan Kennedy
Article & Editing
Graphics & Design

Published
8 minutes ago
on
September 24, 2025
| 40 views
-->
By
Cody Good
Article & Editing