The Credit Crunch Is Going To Be One Of The Biggest Stories Of The Next 6 Months

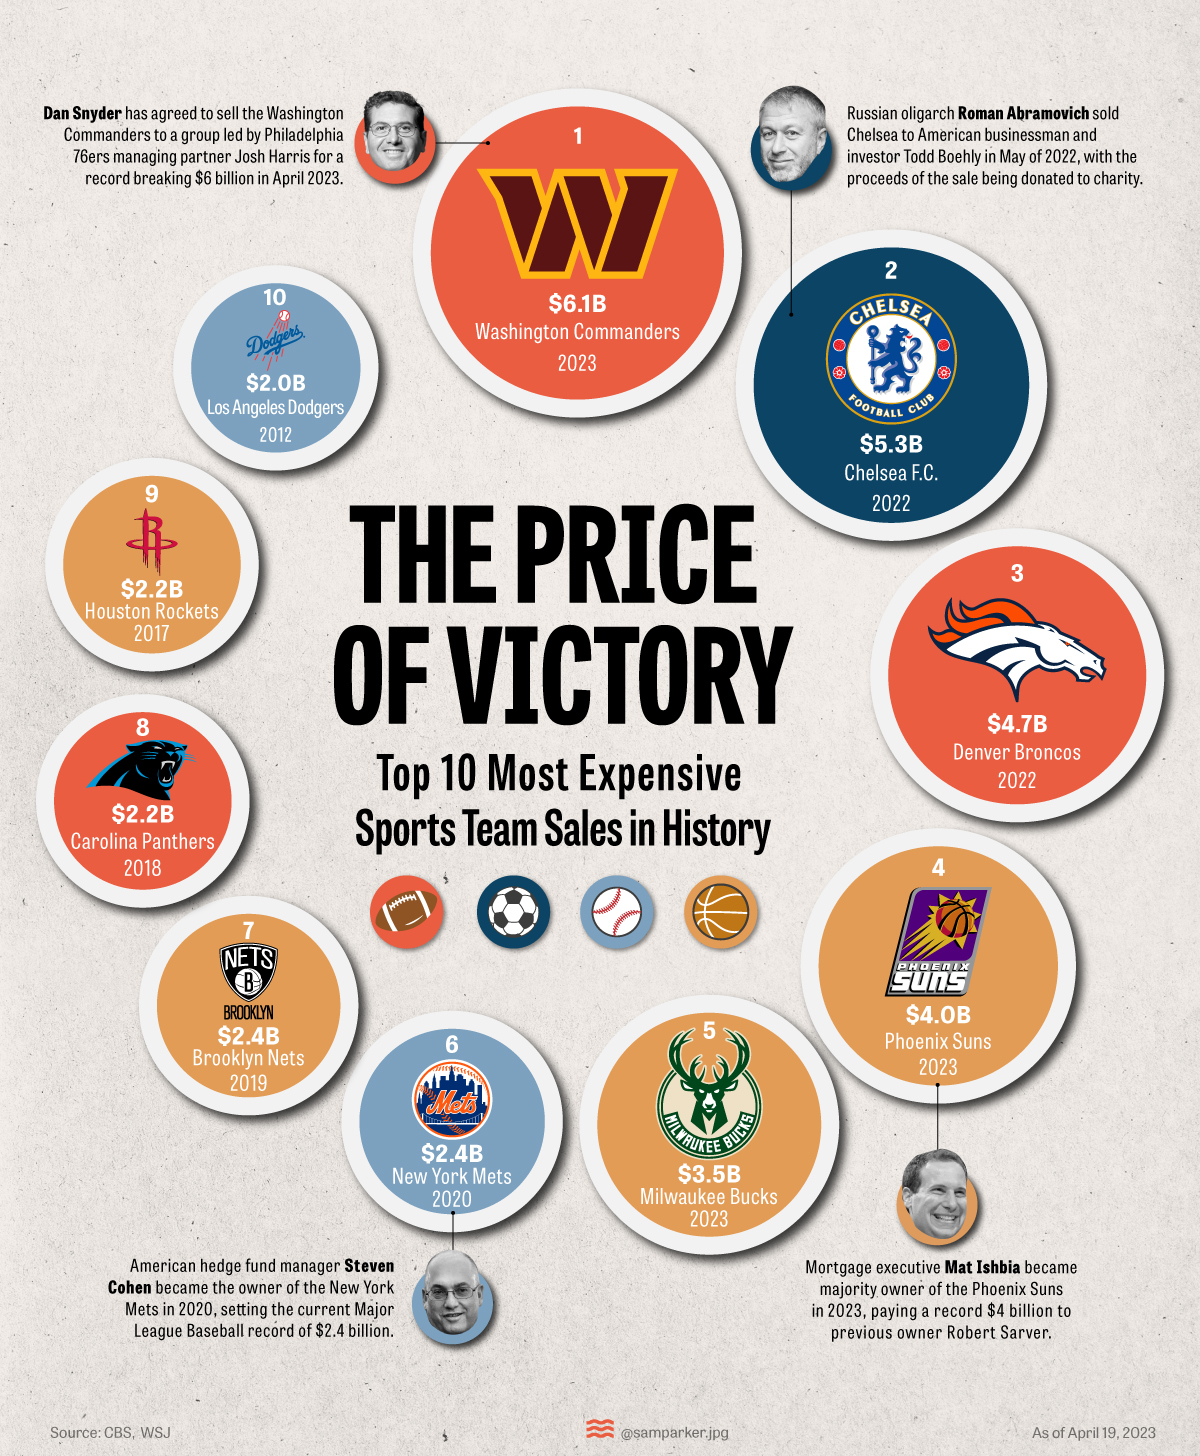
Ranking the Biggest Sports Team Sales in History
After a record-setting year in 2022, professional sports team sales are on an uptick yet again.
The tentative $6.05 billion Washington Commanders sale, already approved by other NFL owners, will be the highest amount paid for a sports team once completed.
Subscribe to the Elements free mailing list for more like this
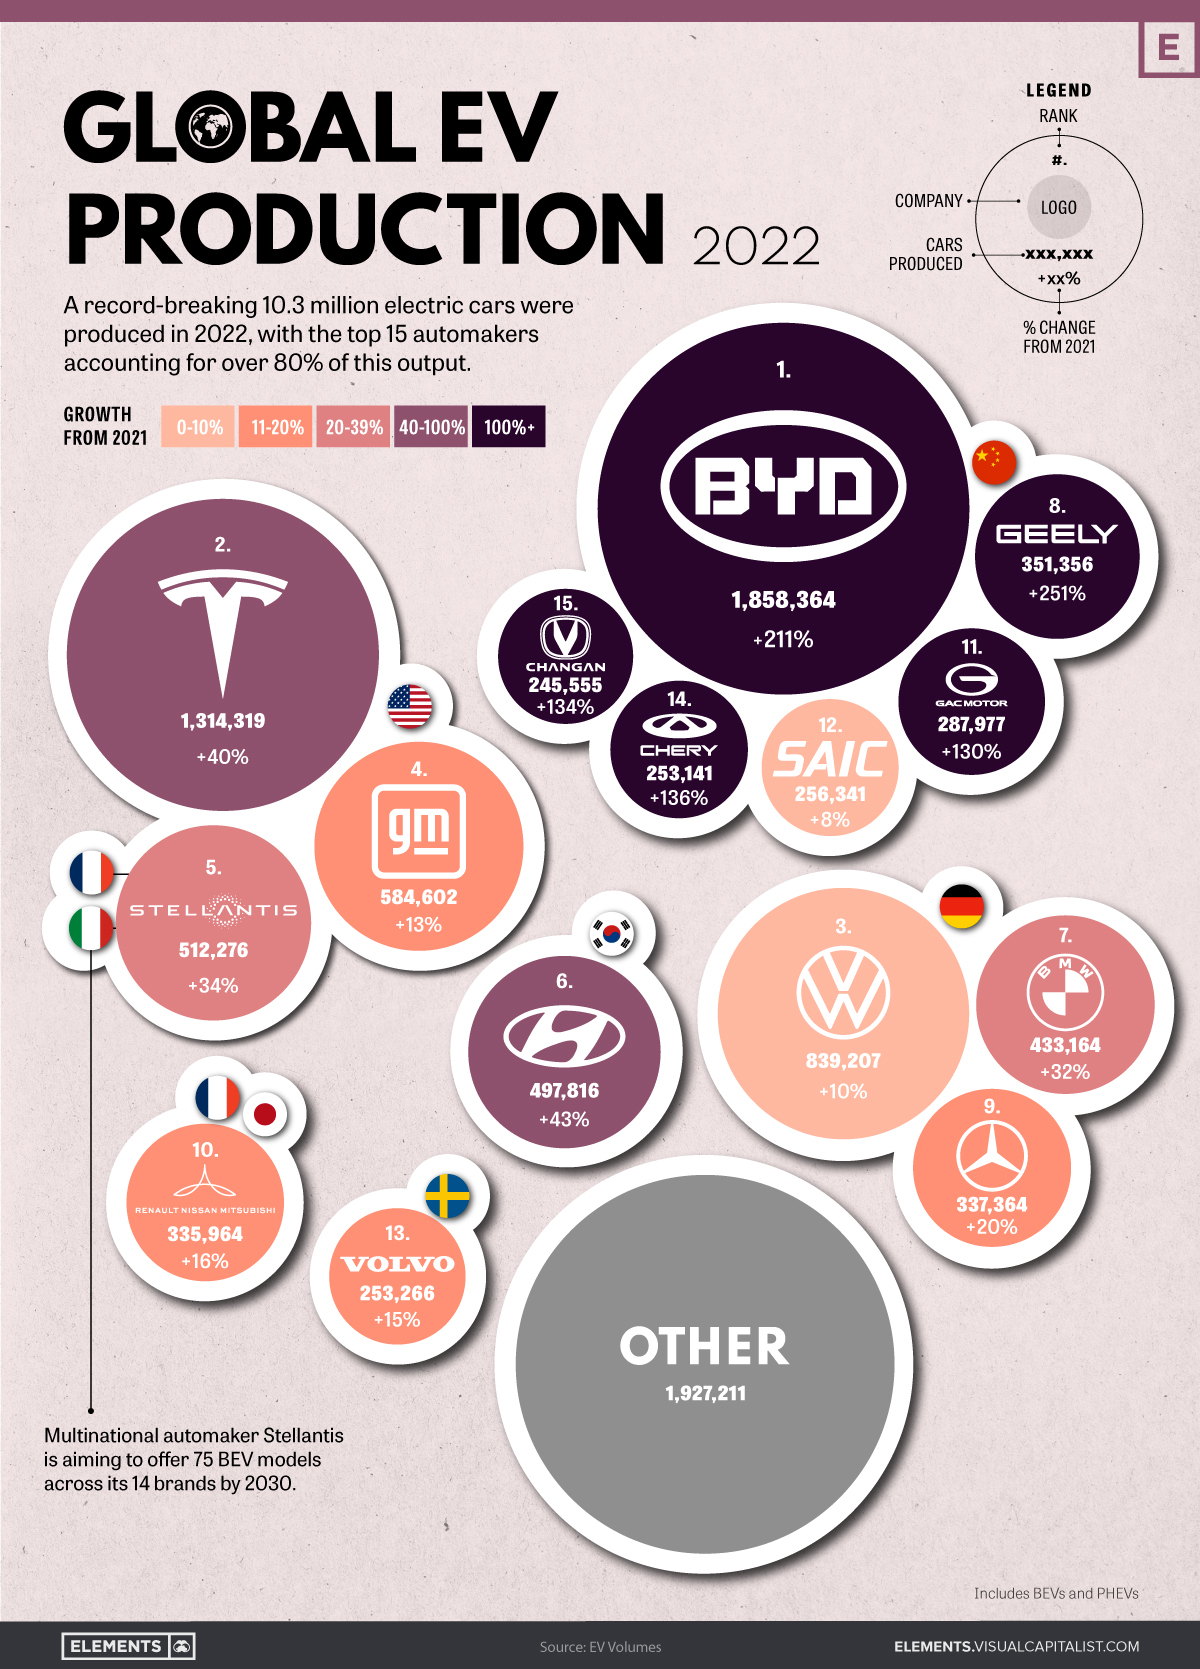
Global EV Production: BYD Surpasses Tesla
This was originally posted on Elements. Sign up to the free mailing list to get beautiful visualizations on natural resource megatrends in your email every week.

Click to view this graphic in a higher-resolution.
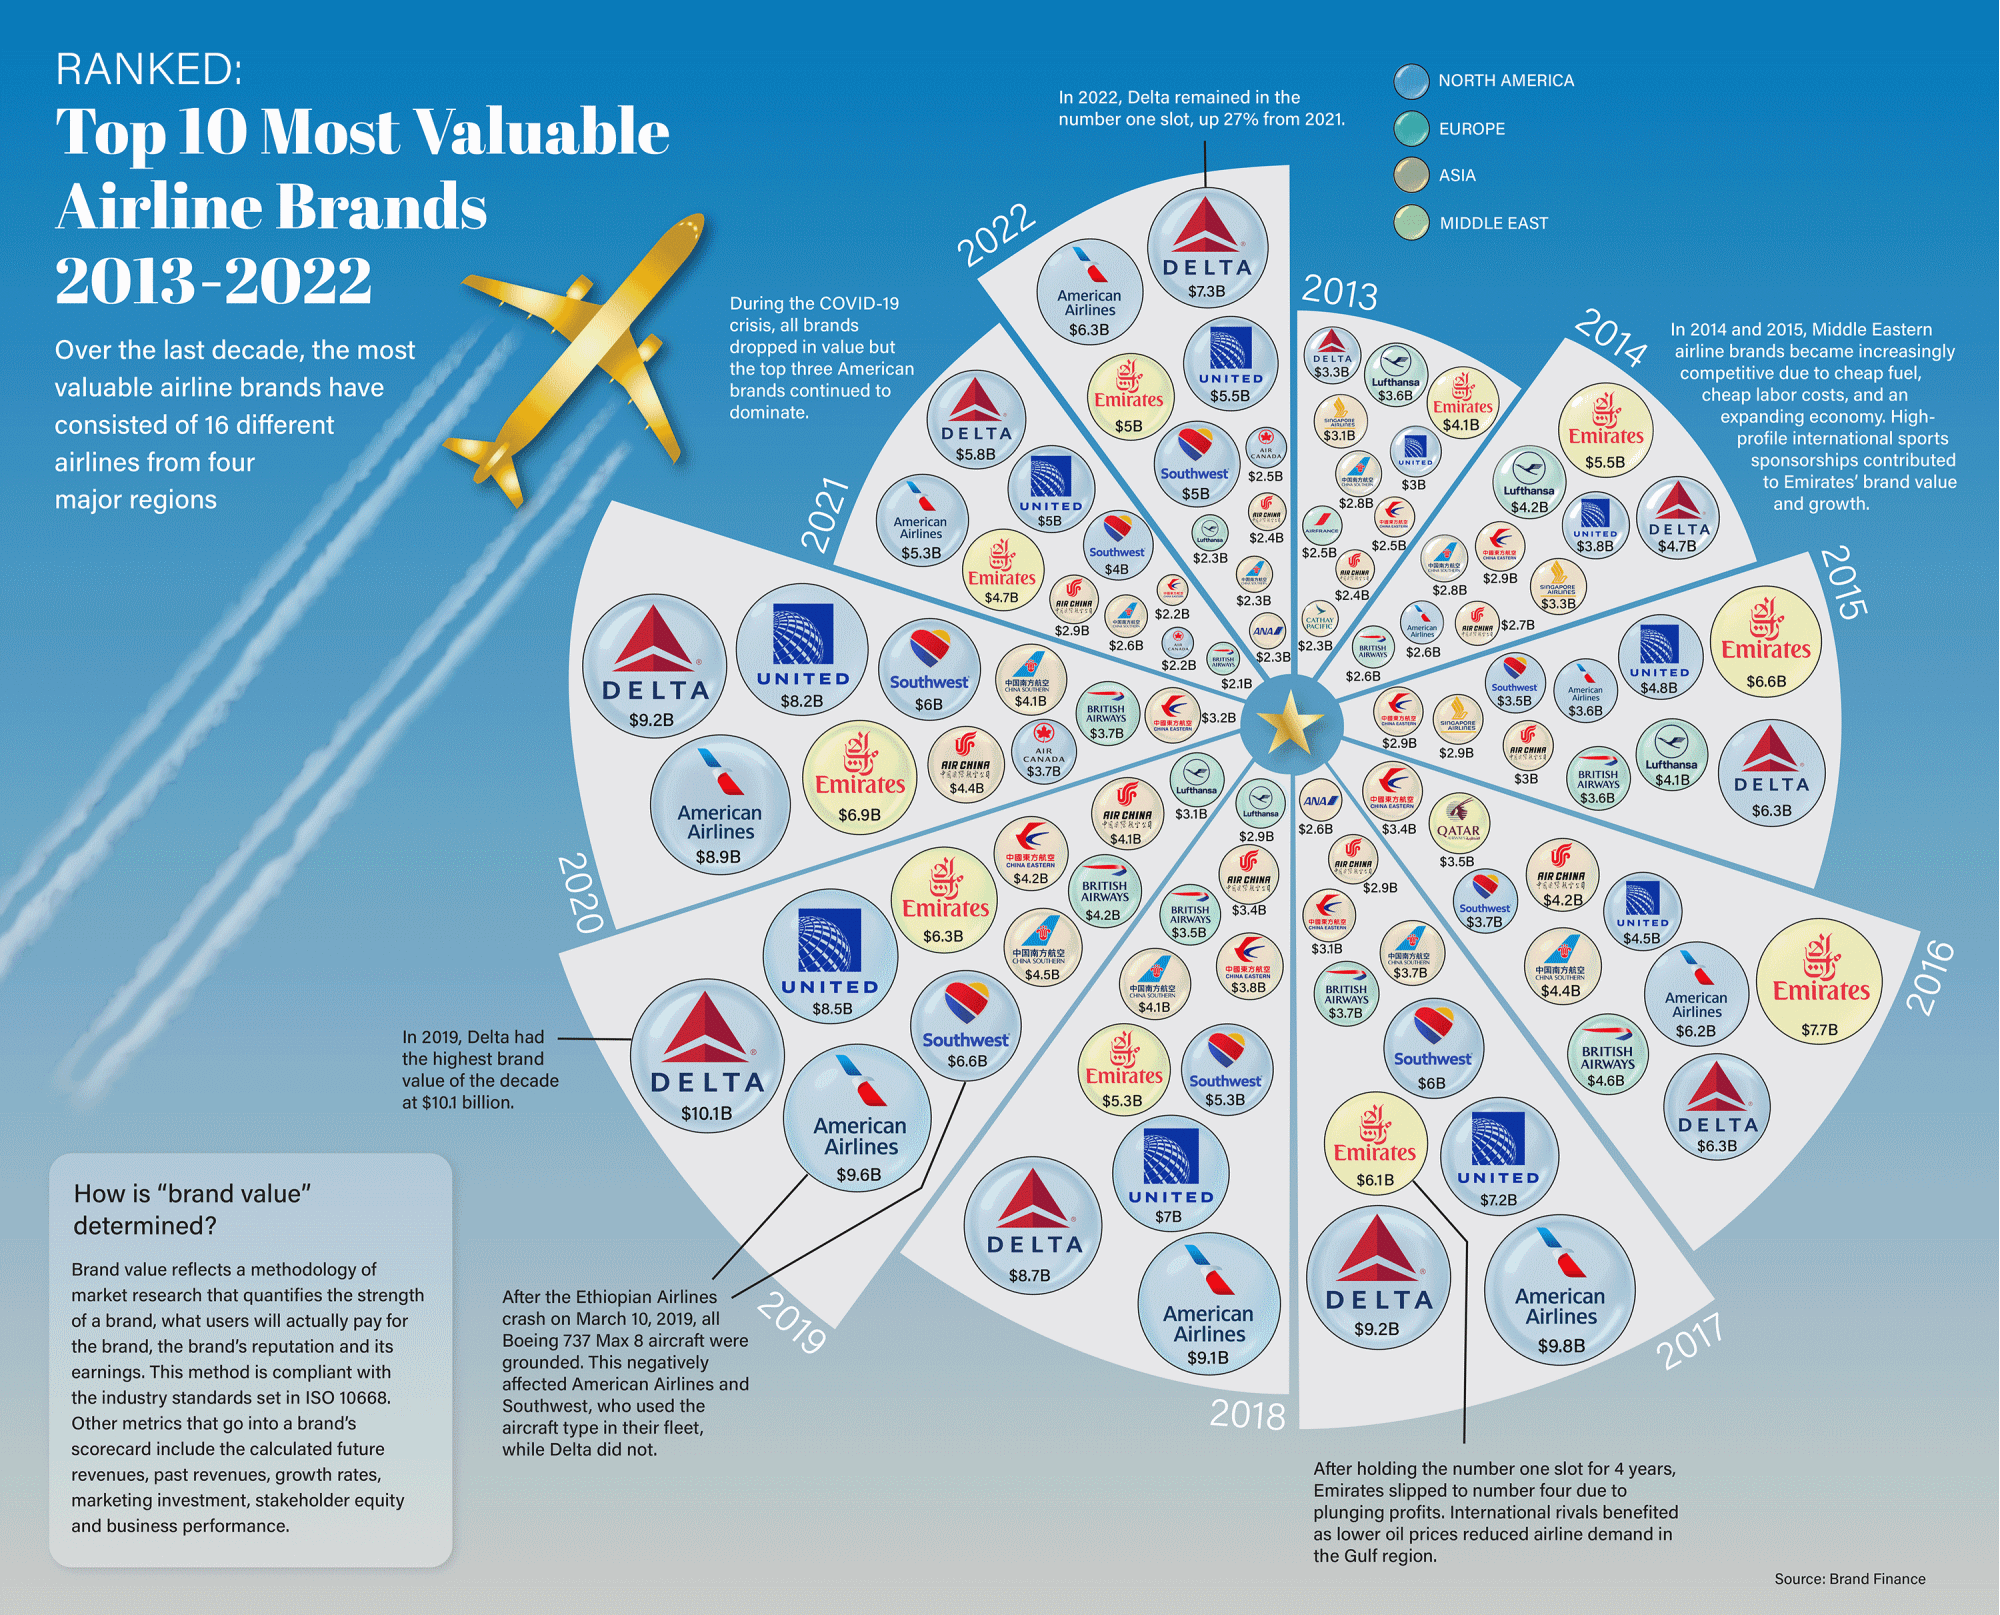
Top 10 Most Valuable Airline Brands Since 2013
The global airline industry was experiencing strong growth before the pandemic wiped out years of momentum.