You are here

Business

Valeant Bond Price Pukes As Moody's Threatens Downgrade Over Weak Performance

With CDS markets implying around a 40% probability of default, Moody's has issued a warning over Valeant's deleveraging prospects (and ability to deliver sustainable growth) putting $31 billion of biotech debt on watch for downgrade. VRX bonds are down dramatically on the day.. not the forst day back at work Pearson was hoping for.
Electric Car War Sends Lithium Prices Sky High

Submitted by James Stafford via OilPrice.com,

With lithium prices skyrocketing beyond wildest expectations, talk heating up about acquisitions and mergers in this space and a fast-brewing war among electric car rivals, it’s no wonder everyone’s bullish on this golden commodity that promises to become the ‘’new gasoline”.

Moreover, land grabs, rising price predictions, and expectations of a major demand spike are leaping out of the shadows of a pending energy revolution and a new technology-driven resource era.

Russian Report: Freemasonic Forces Led By Trump To Launch Coup On America

A 500-page Security Council report released this weekend warns that the United States is about to become embroiled in a coup in which Freemasonic forces led by Donald Trump are going to launch a deadly attack on the Federal Reserve System and shadowy elite.  Following the 2008 financial collapse which benefited “shadow government”, an American-British Freemason cabal rose to power, headed by Donald Trump, in order to restore order to the chaos.

Gold-Silver Ratio Breakout Report, 28 Feb, 2016

Gold-Silver Ratio Breakout Report, 28 Feb, 2016

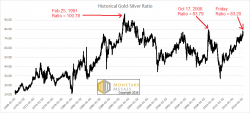
The gold to silver ratio moved up very sharply this week, +4.2%. How did this happen? It was not because of a move in the price of gold, which barely budged this week. It was due entirely to silver being repriced 66 cents lower.

This ratio is now 83.2. It takes 83.2 ounces of silver to buy an ounce of gold. Conversely, it takes 1/83.2oz (about 0.37 grams) of gold to buy an ounce of silver.

This ratio is now within a hair’s breadth of breaking out past the high set on Oct 17, 2008. See the historical graph (based on LBMA silver fix and PM gold fix data, provided by Quandl).

The Three Charts That No Small Cap Asset Manager Wants You To See

The Three Charts That No Small Cap Asset Manager Wants You To See

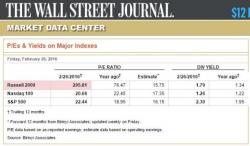
A funny thing happens to an index's valuation when you choose not to entirely ignore the companies that have negative earnings (i.e. losses). Ever wondered what the P/E ratio of the Russell 2000 was given that it is full of companies where the 'E' is negative? The answer is simple - and ugly - as The Wall Street Journal exposes, the aggregate P/E of the Russell 2000 is over 200x which perhaps explains the gaping chasm between bond and equity valuations for this highly credit-sensitive cohort.


Pages