![]()
See this visualization first on the Voronoi app.
Mapped: Farmland by State in 2025
This was originally posted on our Voronoi app. Download the app for free on iOS or Android and discover incredible data-driven charts from a variety of trusted sources.
Key Takeaways
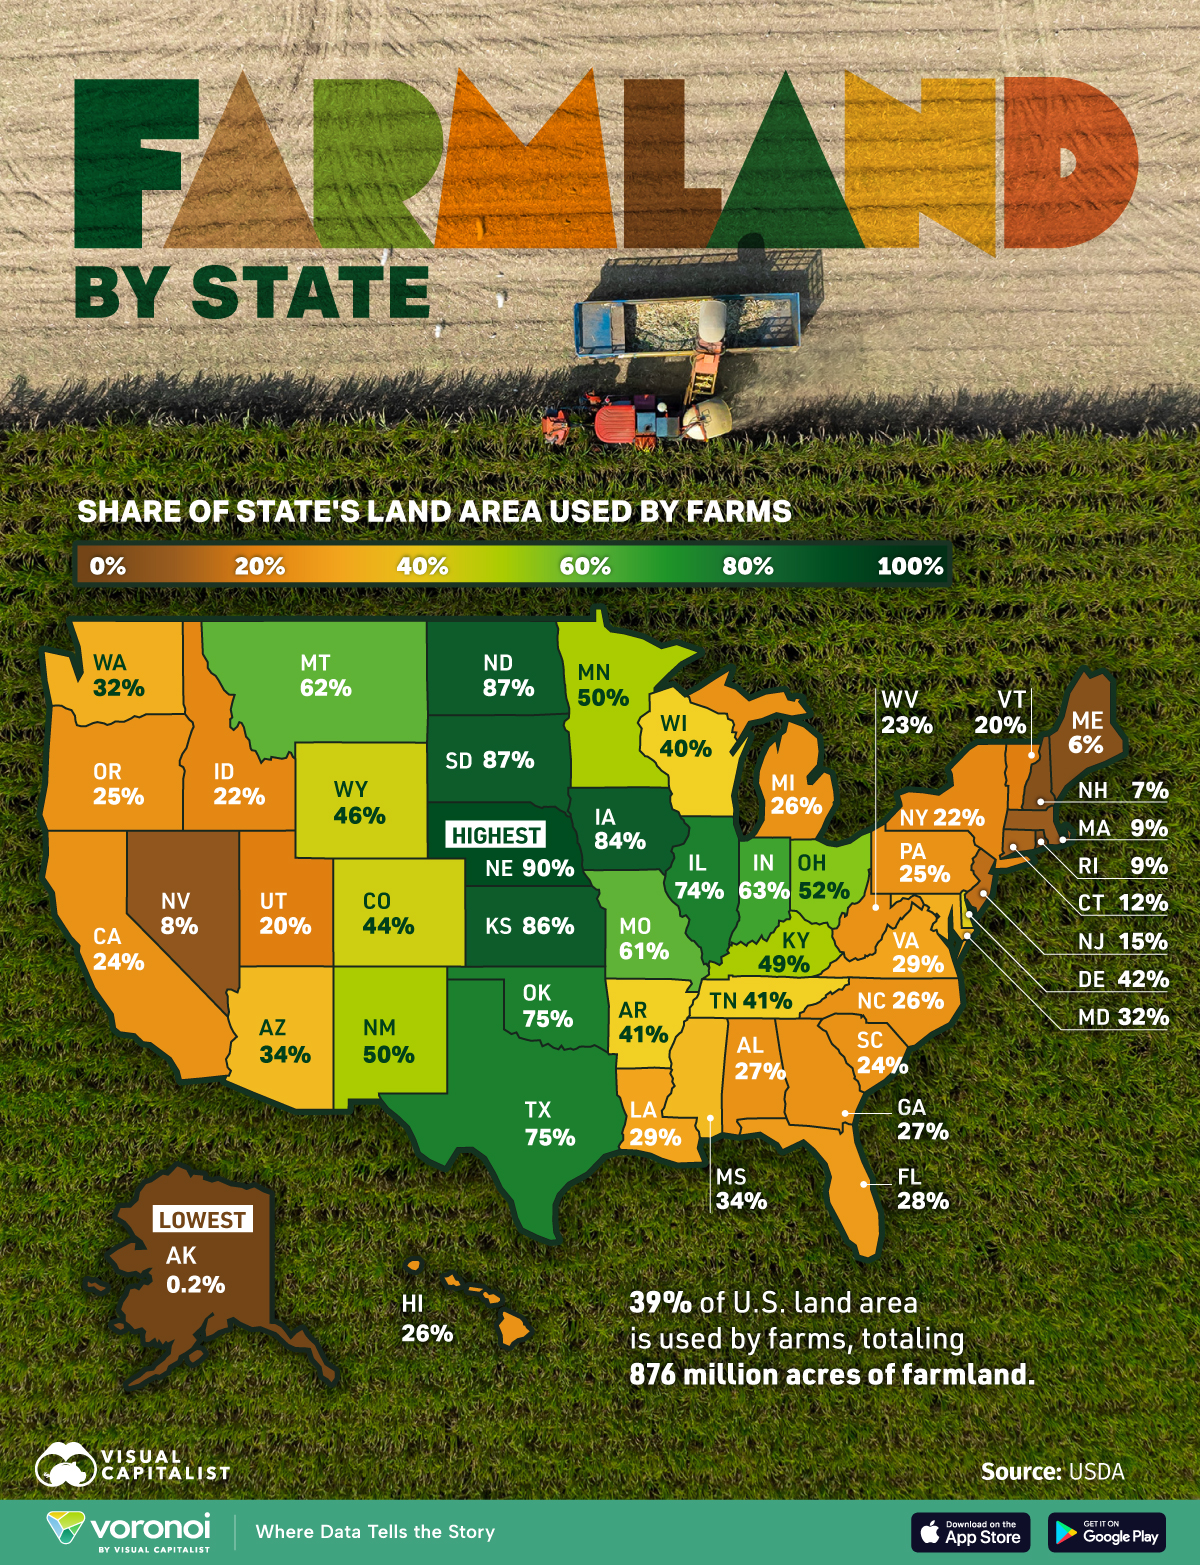
- Farmland covers 876 million acres, or 39% of U.S. land.
- Great Plains states dominate: Nebraska tops the list at 89.5% farmland.
Much of the vast space of the U.S. is occupied by farmland, which produces many of the most demanded commodities. But which states have the most of their area used by farms?
The map uses the latest data from the U.S. Department of Agriculture (USDA) to show the share of each state’s land area used for farming.
The Breadbasket’s Farmland Dominance
From the nation’s agricultural core to coastal outliers, this table shows each state’s “farms’ share of state land area,” a comparable measure that helps explain where farming is most land-intensive.
| State | Farms' Share of State's Land Area |
|---|---|
| Alabama | 26.5% |
| Alaska | 0.2% |
| Arizona | 34.4% |
| Arkansas | 40.8% |
| California | 23.8% |
| Colorado | 44.2% |
| Connecticut | 11.9% |
| Delaware | 41.7% |
| Florida | 28.3% |
| Georgia | 26.9% |
| Hawaii | 25.5% |
| Idaho | 21.7% |
| Illinois | 74% |
| Indiana | 63.2% |
| Iowa | 83.9% |
| Kansas | 85.6% |
| Kentucky | 49.1% |
| Louisiana | 28.9% |
| Maine | 6.1% |
| Maryland | 32.2% |
| Massachusetts | 9.4% |
| Michigan | 26% |
| Minnesota | 49.8% |
| Mississippi | 34% |
| Missouri | 61.1% |
| Montana | 61.6% |
| Nebraska | 89.5% |
| Nevada | 8.4% |
| New Hampshire | 7.3% |
| New Jersey | 14.9% |
| New Mexico | 50.1% |
| New York | 21.6% |
| North Carolina | 26% |
| North Dakota | 87.2% |
| Ohio | 51.6% |
| Oklahoma | 74.9% |
| Oregon | 24.9% |
| Pennsylvania | 24.8% |
| Rhode Island | 9.1% |
| South Carolina | 23.9% |
| South Dakota | 87.2% |
| Tennessee | 40.5% |
| Texas | 74.8% |
| Utah | 20% |
| Vermont | 20.3% |
| Virginia | 28.9% |
| Washington | 32.4% |
| West Virginia | 22.8% |
| Wisconsin | 39.8% |
| Wyoming | 46.3% |
Together, U.S. farms account for roughly 39% of the country’s land area—about 876 million acres.
Nebraska ranks first with 89.5% of its land in farms. North Dakota and South Dakota follow closely at 87.2% each. Kansas (85.6%) and Iowa (83.9%) round out the top five, reflecting deep prairie soils and flat terrain that support large-scale row crops.
Oklahoma (74.9%), Texas (74.8%), and Illinois (74.0%) are also high, underscoring how the Great Plains and Midwest anchor U.S. agricultural land and industry.
Where Farmland Is Scarce in the U.S.
Alaska sits at the bottom with just 0.2% of land in farms. Short growing seasons and limited arable land are key factors, even with long summer daylight.
New England and parts of the coastal Northeast are also low: Maine (6.1%), New Hampshire (7.3%), Rhode Island (9.1%), and Massachusetts (9.4%). Dense populations, forest cover, and competing land uses reduce the agricultural industry’s footprint in these states.
Why Farmland Varies So Much Across the U.S.
Agricultural land share reflects climate, soils, and topography. The prairie states combine fertile mollisol soils with broad, relatively flat landscapes—ideal for mechanized farming.
In the arid Southwest, irrigation enables significant farming but limits the share of land used: New Mexico is about 50.1% while Arizona is 34.4%.
In Alaska, farms face a narrow 90–120 day growing window despite long summer daylight, keeping farmland’s footprint tiny. Altogether, these regional constraints create the striking “belt” of high farm shares through the center of the country.
Learn More on the Voronoi App ![]()
If you enjoyed today’s post, check out the share of U.S. livestock that is factory farmed on Voronoi, the new app from Visual Capitalist.