Panama Canal Traffic by Shipment Category and Tonnage
![]()
See this visualization first on the Voronoi app.
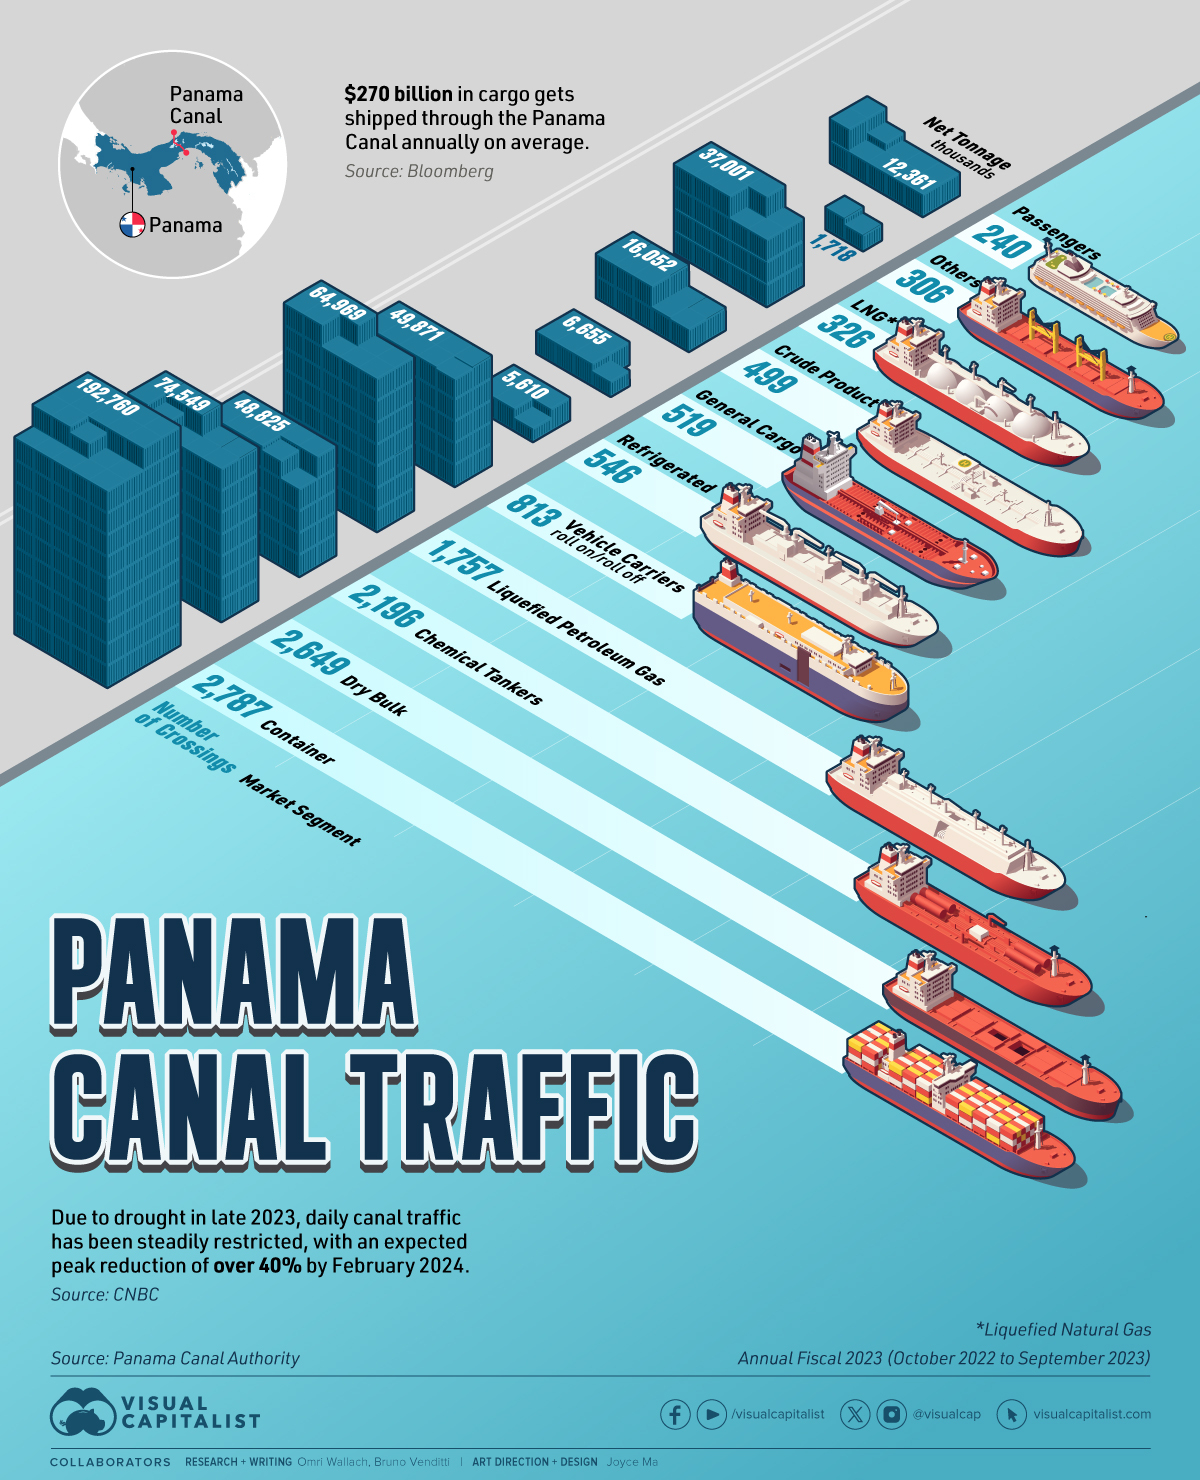
Panama Canal Traffic by Shipment Category and Tonnage
This was originally posted on our Voronoi app. Download the app for free on iOS or Android and discover incredible data-driven charts from a variety of trusted sources.