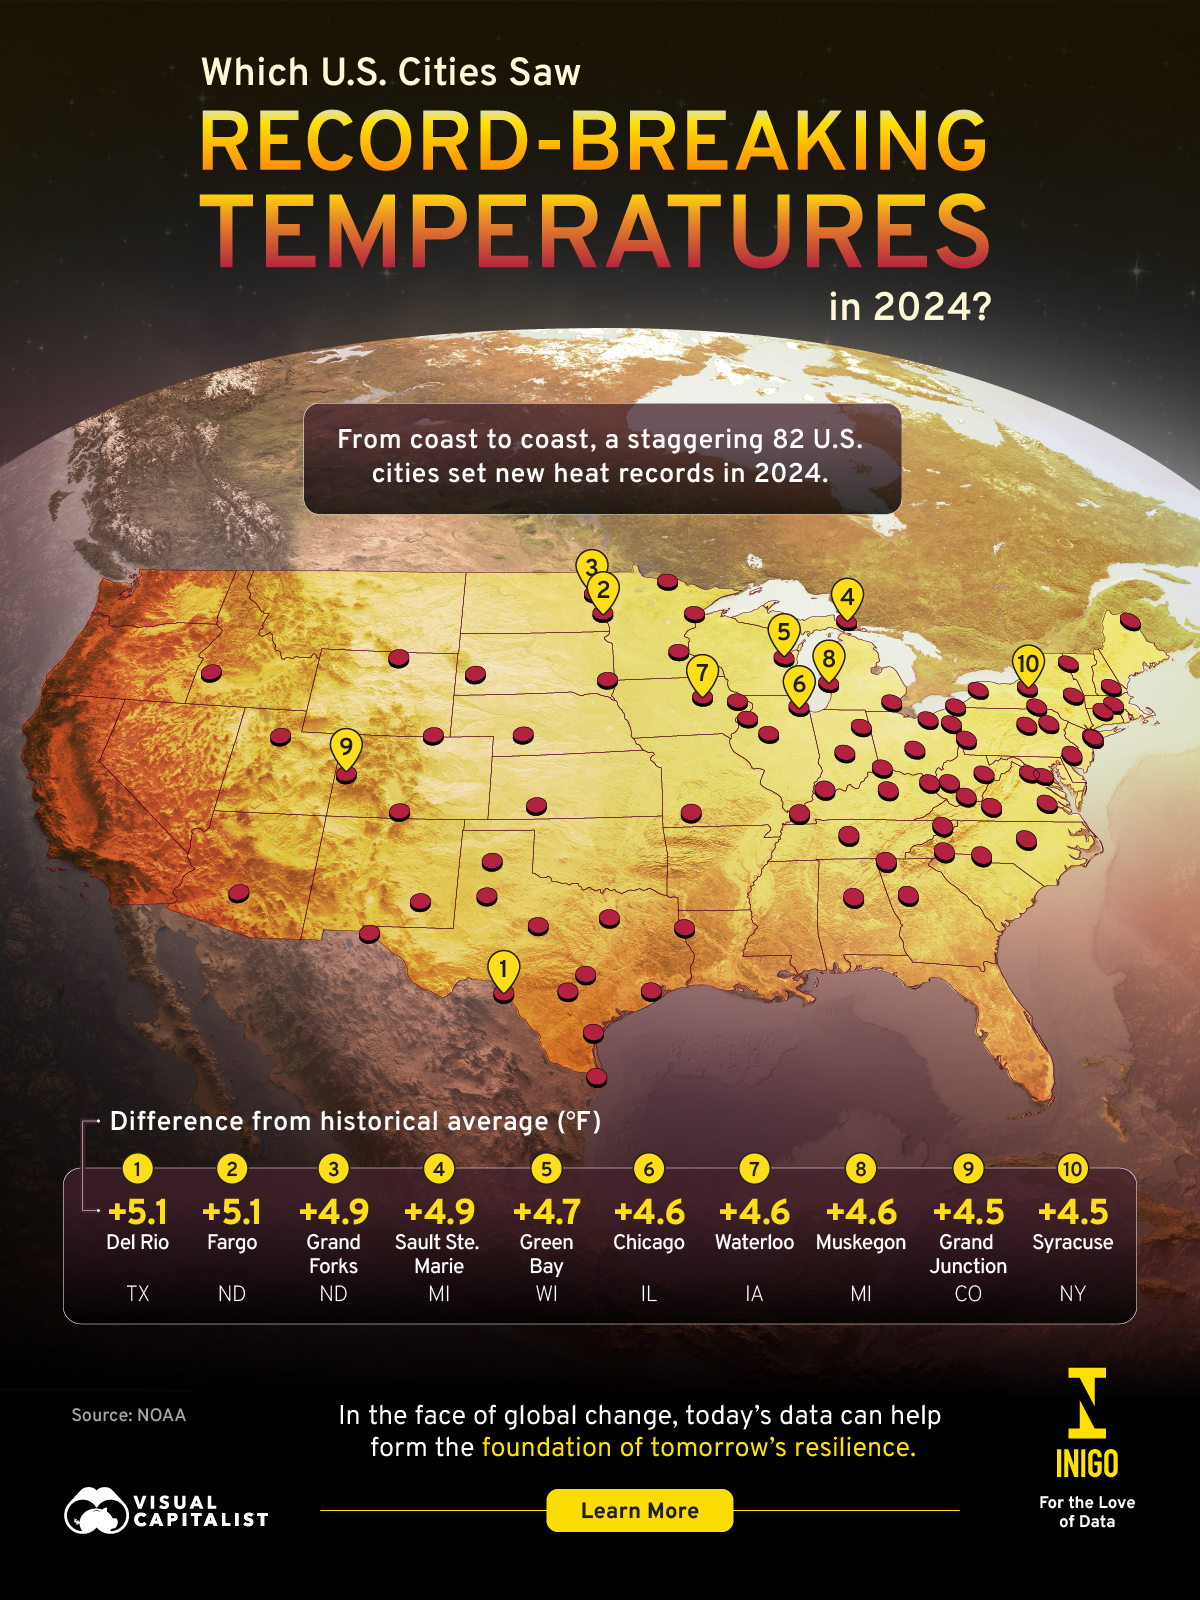
Mapped: Which U.S. Cities Saw Record-Breaking Temperatures in 2024?
Published
54 minutes ago
on
September 26, 2025
| 26 views
-->
By
Julia Wendling
Graphics & Design

Published
54 minutes ago
on
September 26, 2025
| 26 views
-->
By
Julia Wendling
Graphics & Design
Published
8 minutes ago
on
September 24, 2025
| 40 views
-->
By
Cody Good
Article & Editing
![]()
See this visualization first on the Voronoi app.
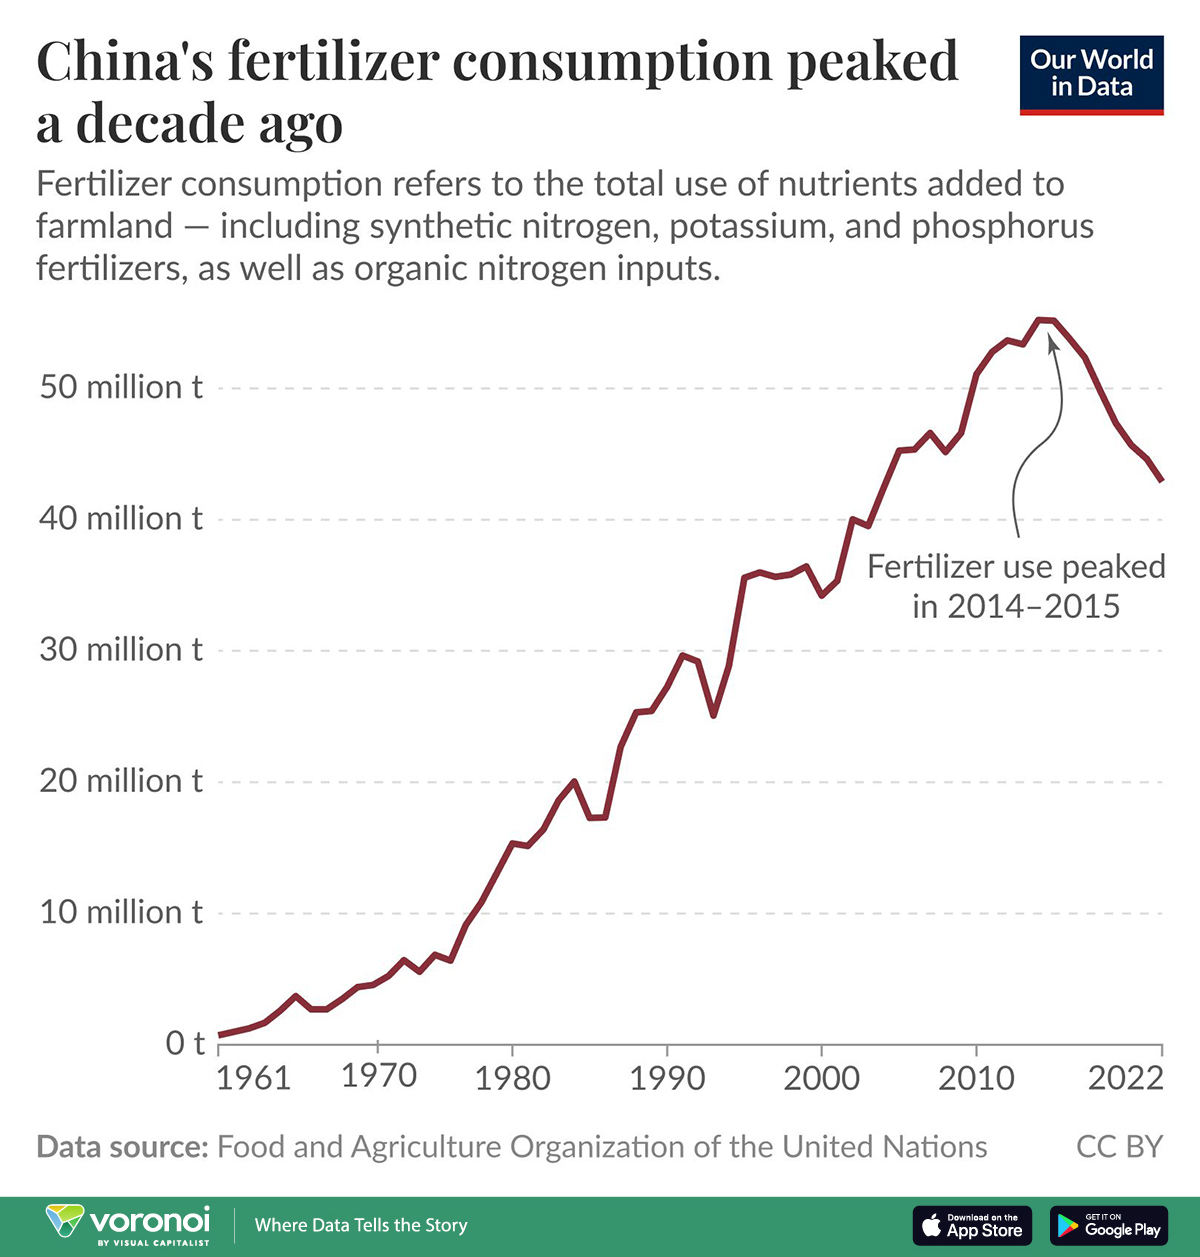
Chart: China’s Fertilizer Consumption Peaked a Decade Ago
This was originally posted on our Voronoi app. Download the app for free on iOS or Android and discover incredible data-driven charts from a variety of trusted sources.
Published
2 hours ago
on
September 23, 2025
| 1,277 views
-->
By
Alan Kennedy
Article & Editing
Graphics & Design
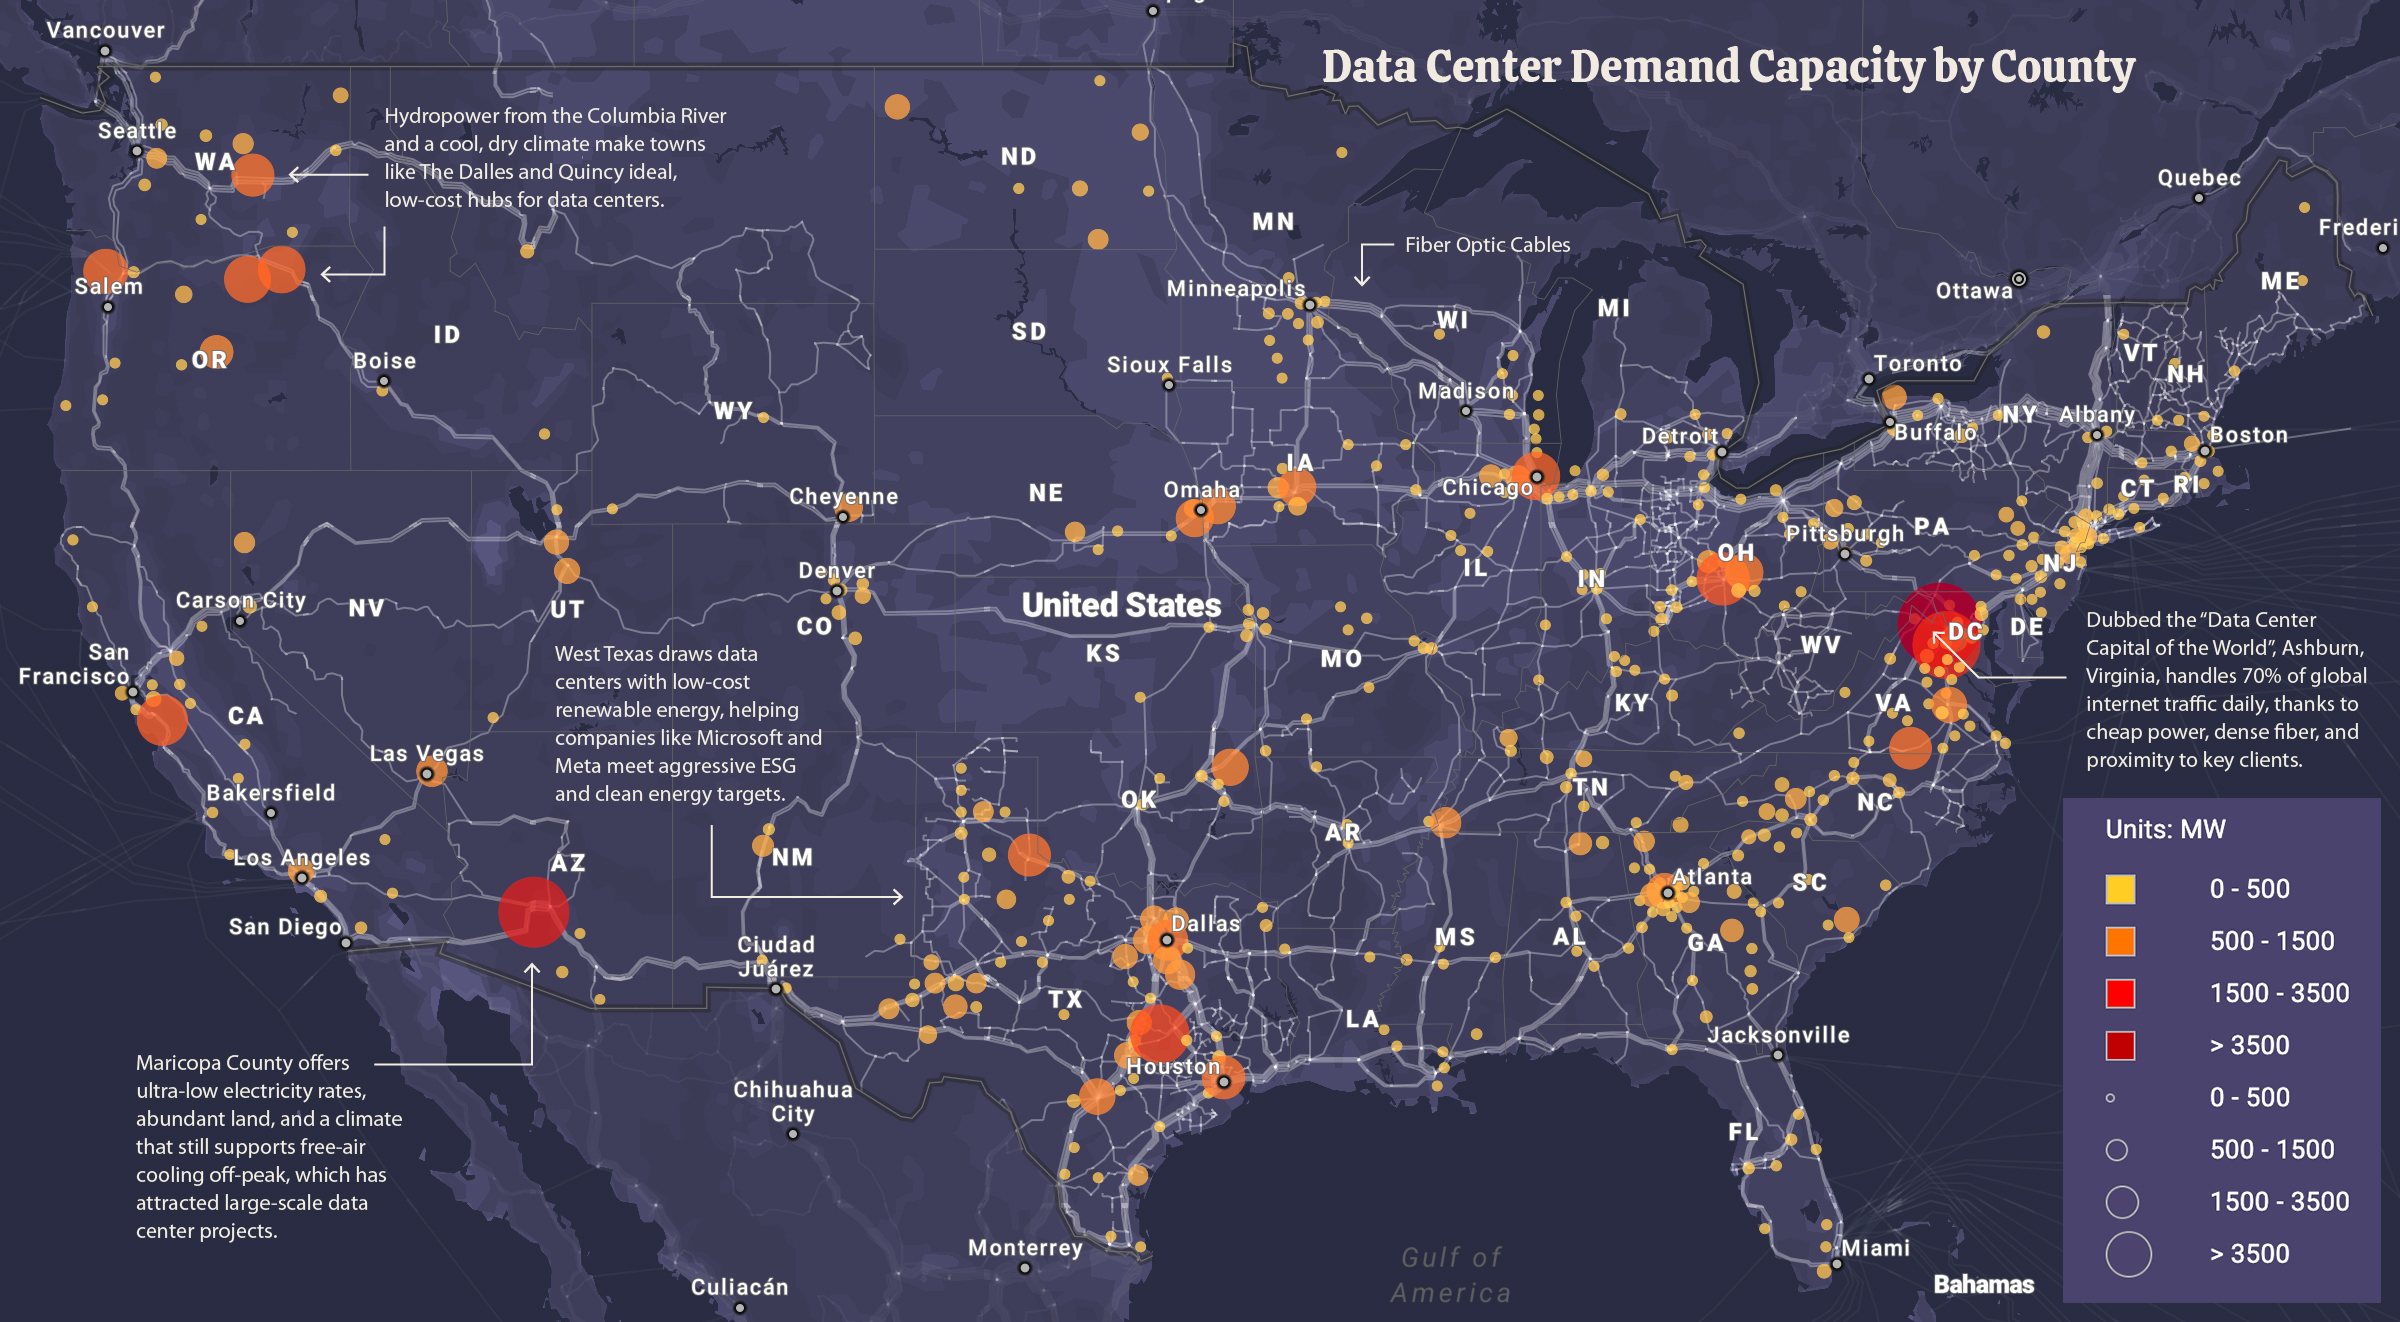
Mapped: The Massive Network Powering U.S. Data Centers