![]()
See this visualization first on the Voronoi app.

Use This Visualization
Visualized: The Age Distribution of Nuclear Reactors
This was originally posted on our Voronoi app. Download the app for free on iOS or Android and discover incredible data-driven charts from a variety of trusted sources.
Key Takeaways
- Around two-thirds of the world’s 416 nuclear reactors are over 30 years old
- Newer reactors built in the last 10 years have higher average capacity per unit than older reactors
Nuclear power has long been a reliable carbon-free energy source, accounting for around 10% of electricity generation globally.
Although nuclear reactors are costly to build, they are often built to last for several decades and can operate for up to 80 years with lifetime extensions. But how old is the world’s current nuclear reactor fleet?
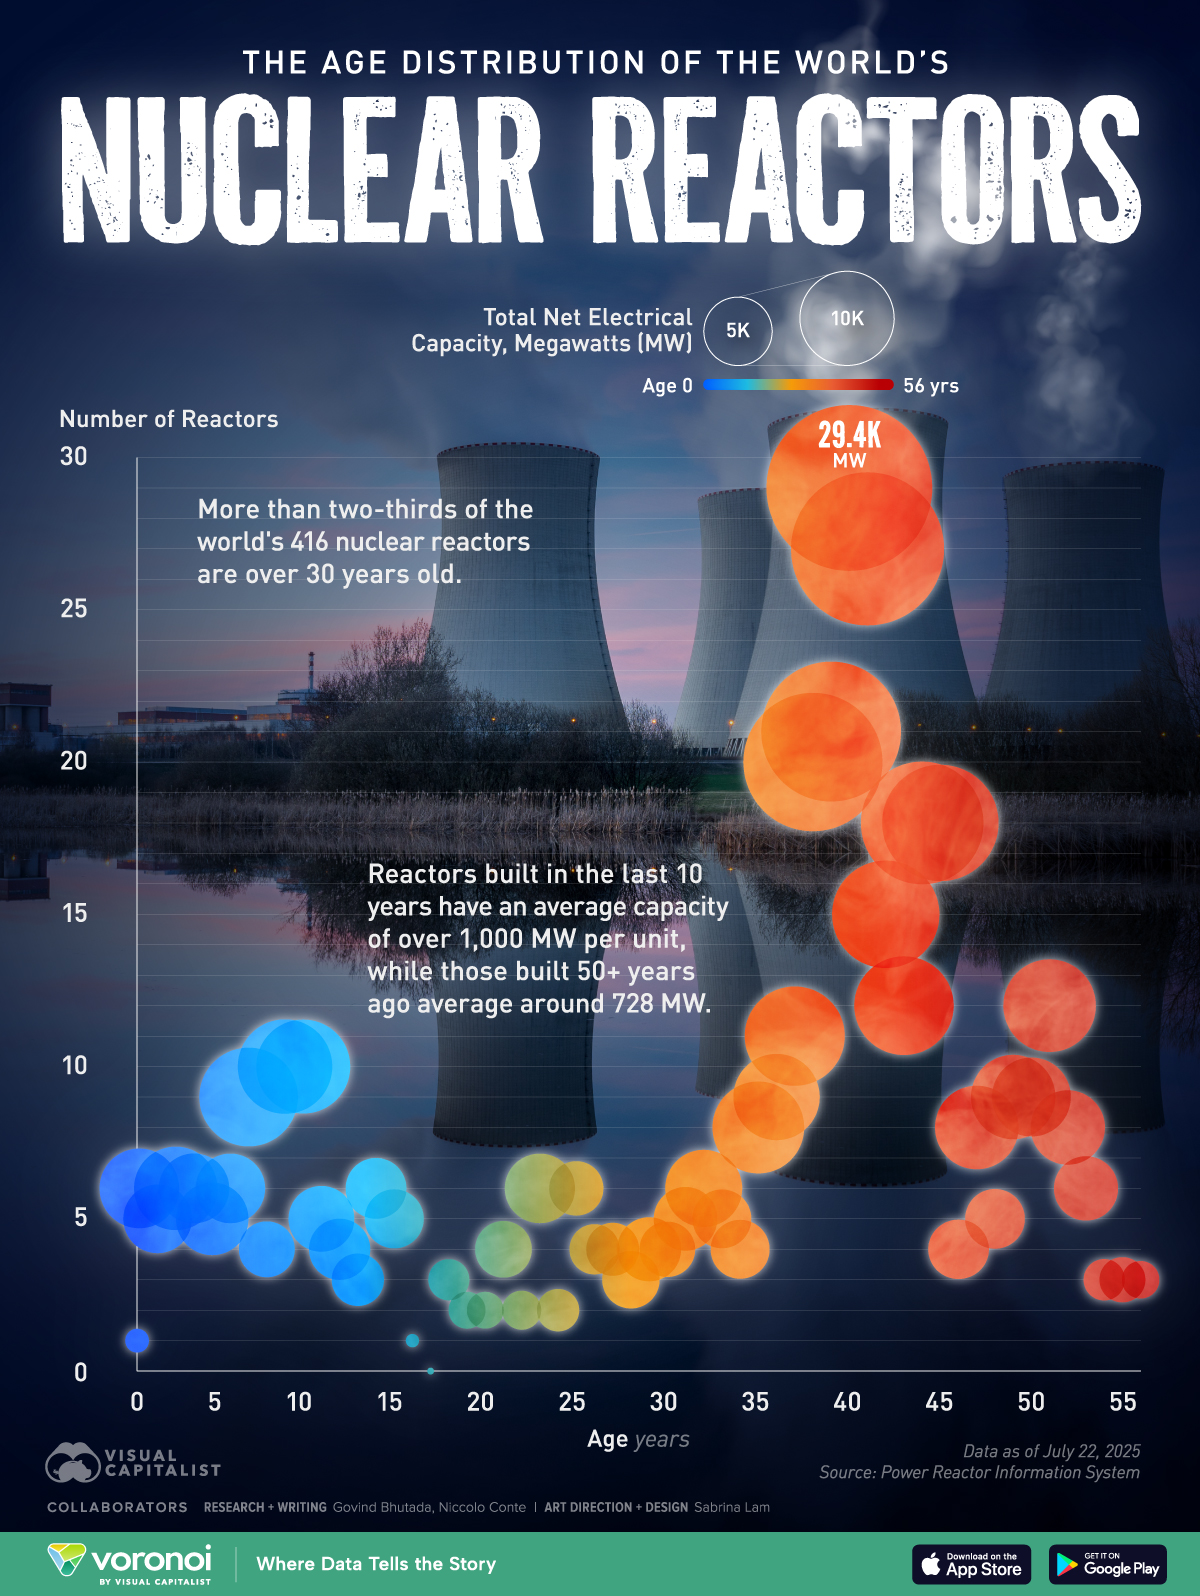
This infographic shows the age distribution of global nuclear reactors, highlighting the number of nuclear reactors by age and their total electricity generation capacity, based on data from the Power Reactor Information System (PRIS).
How Old Are the World’s Nuclear Reactors?
As of 2025, the global nuclear fleet has 416 operational reactors with a combined net electrical capacity of 376 gigawatts, down from 422 reactors in 2023.
Here’s how the world’s nuclear reactors are distributed by age and capacity:
| Age | Number of Reactors | Net Electrical Capacity (megawatts) |
|---|---|---|
| 0–10 | 68 | 69,094 |
| 11–20 | 31 | 24,493 |
| 21–30 | 39 | 32,610 |
| 31–40 | 118 | 116,758 |
| 41–50 | 125 | 107,999 |
| 51–60 | 35 | 25,307 |
| Total | 416 | 376,261 |
Around two-thirds of the world’s nuclear reactors—280 of the 416—were built from the 1970s through the 1990s, and are over 30 years old today. These reactors also represent 66% of global nuclear electricity generation capacity. Specifically, reactors aged 40 years represent the peak, with 29 units contributing nearly 30,000 megawatts (MW) to the global grid.
Nuclear reactor construction saw a slowdown in the late 1990s and early 2000s, following the Chernobyl and Three Mile Island accidents, as concerns over nuclear safety took center stage.
However, the industry has seen a resurgence over the last decade, with over 60 reactors commencing operations in the last 10 years. Furthermore, these new reactors are larger and more efficient, with an average capacity of over 1,000 MW per unit, compared to around 730 MW for those built over 50 years ago.
Learn More on the Voronoi App ![]()
If you enjoyed this infographic, check out this graphic on the share of renewable electricity generation across European countries.