This Is The Worst Global Food Crisis In Modern History, And It Is About To Go To An Entirely New Level


Published
40 mins ago
on
September 12, 2023
| 26 views
-->
By
Rida Khan
Graphics & Design

Subscribe to the Elements free mailing list for more like this
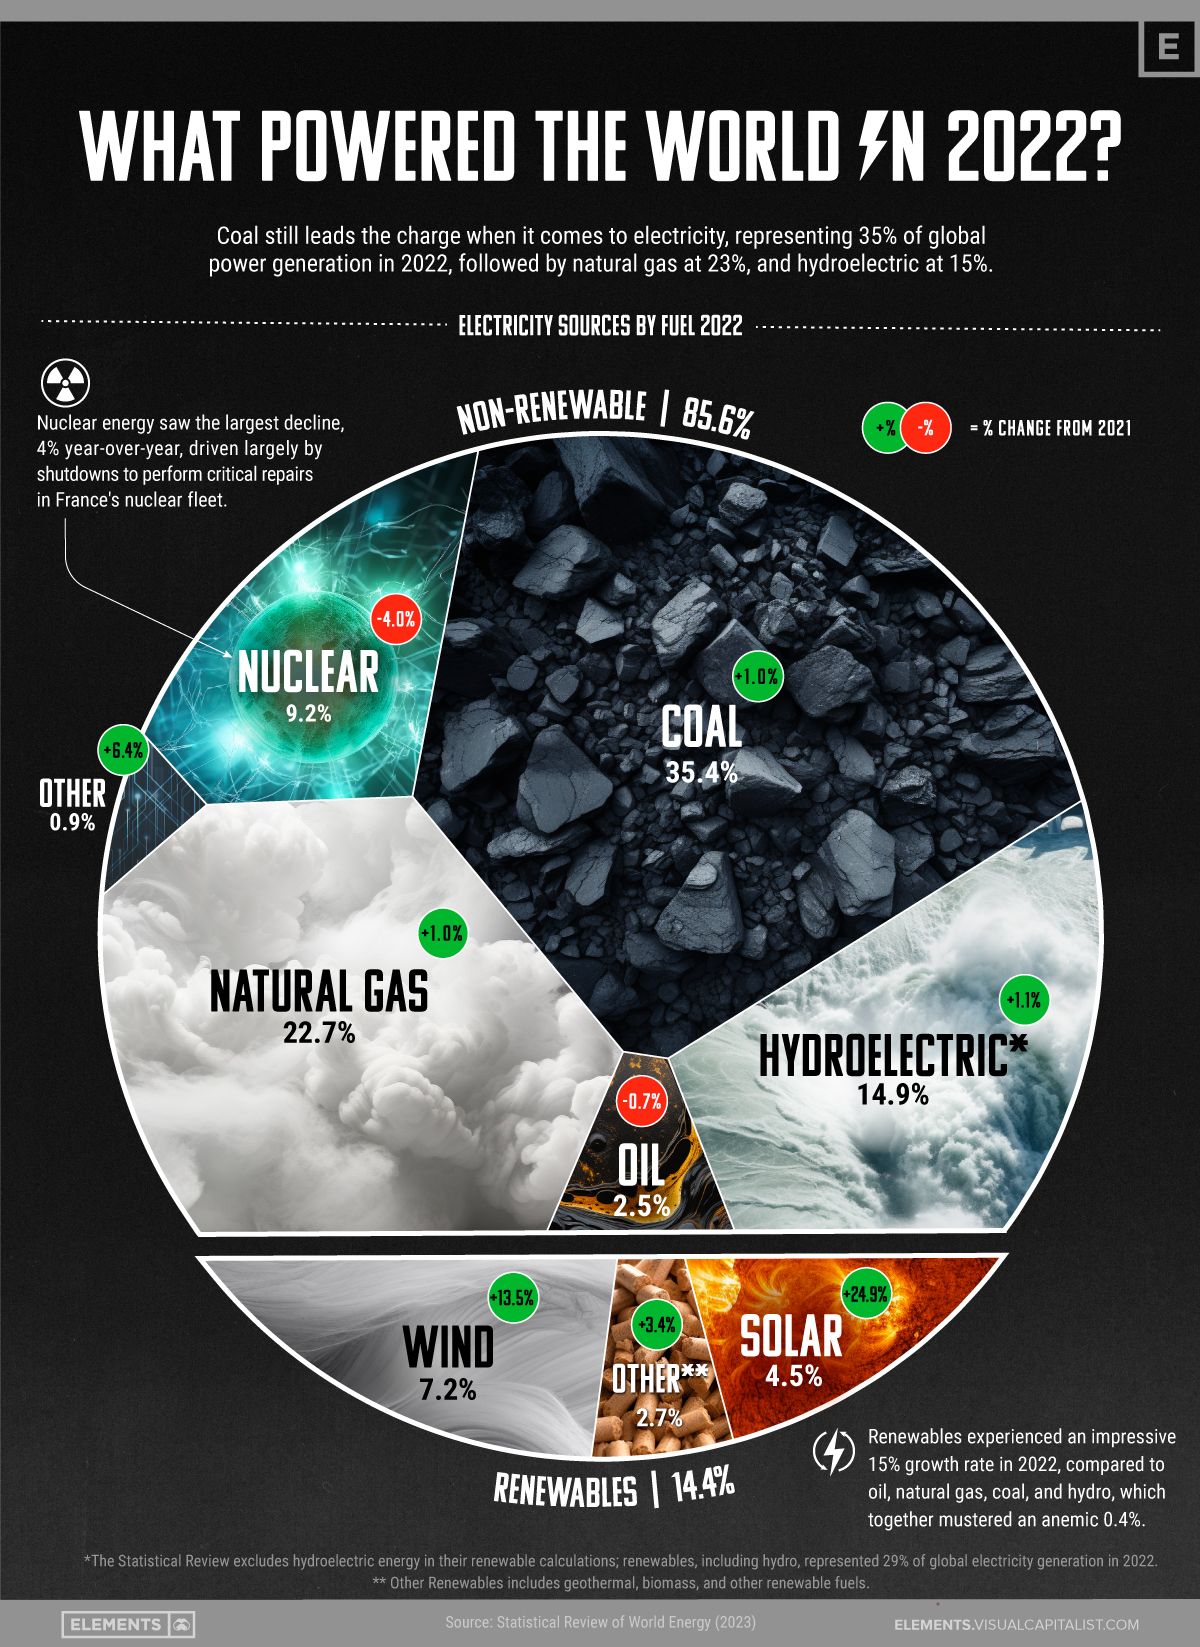
What Powered the World in 2022?
This was originally posted on Elements. Sign up to the free mailing list to get beautiful visualizations on real assets and resource megatrends each week.
In 2022, 29,165.2 terawatt hours (TWh) of electricity was generated around the world, an increase of 2.3% from the previous year.


Published
1 hour ago
on
September 8, 2023
| 66 views
-->
By
Tessa Di Grandi
Graphics & Design