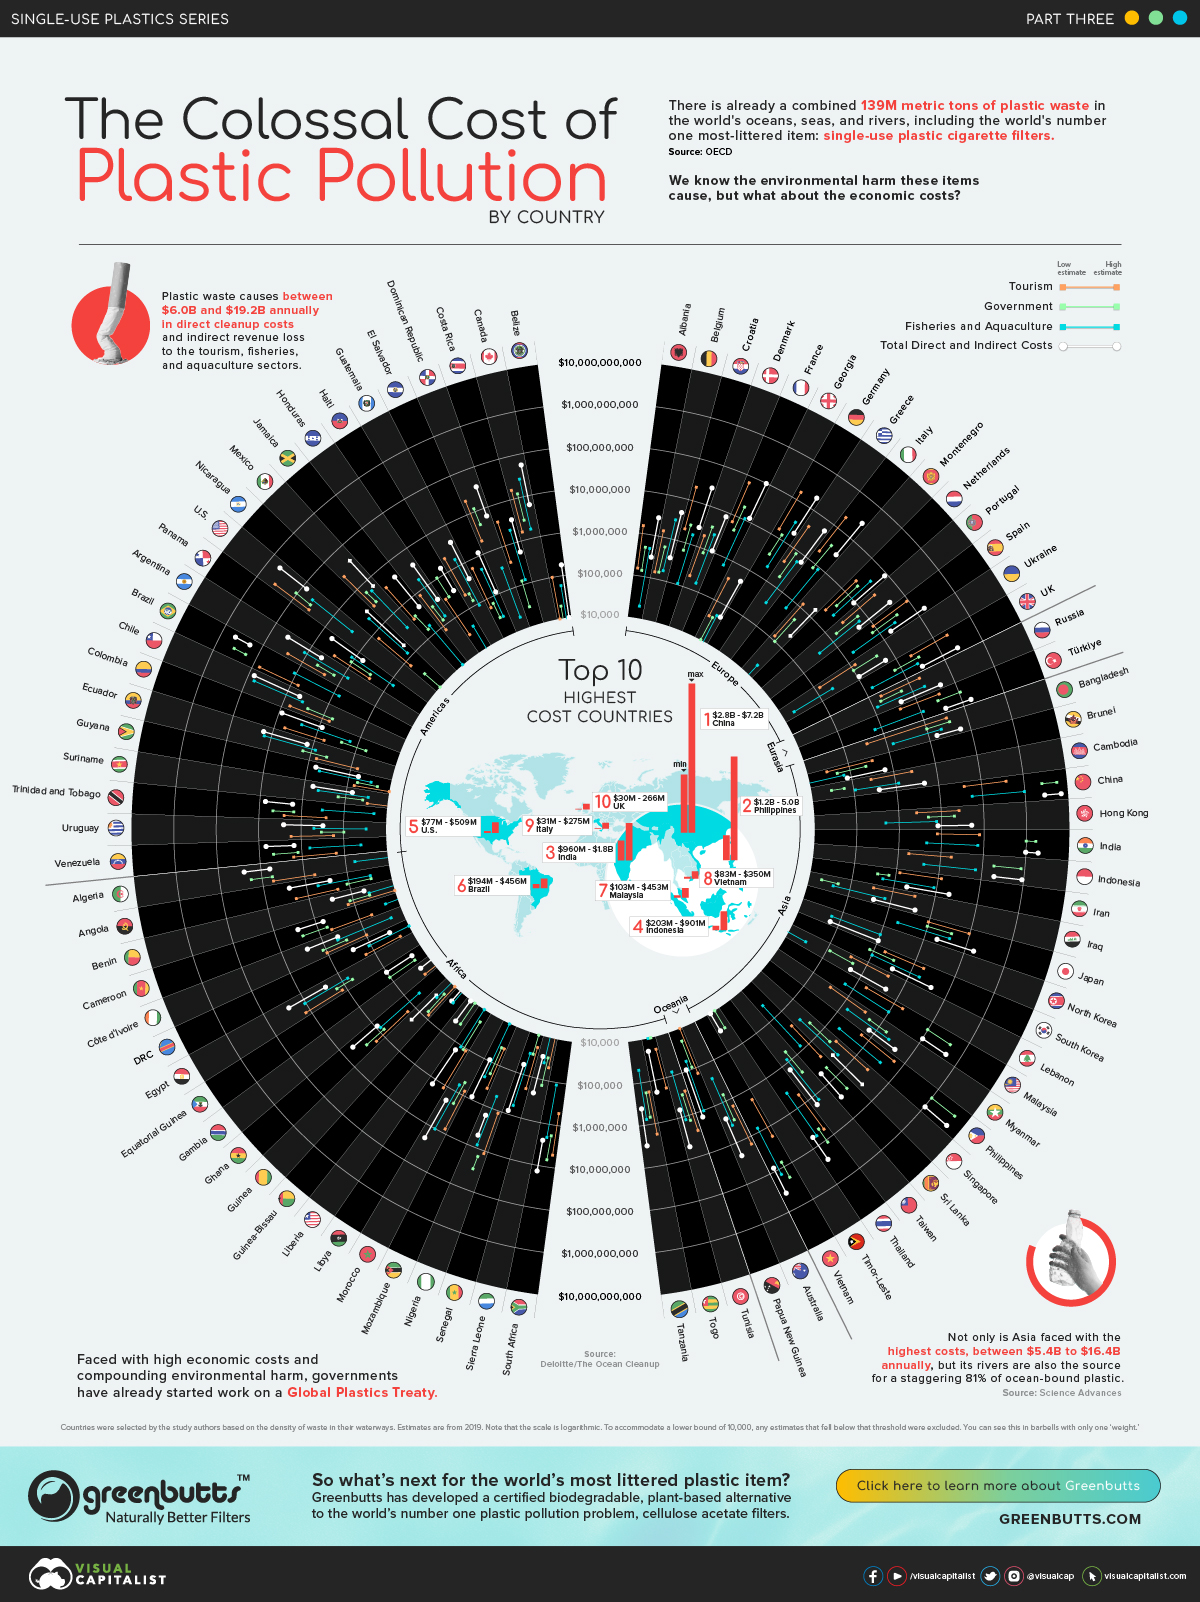
Mapped: The Colossal Cost of Plastic Pollution, By Country
Published
23 mins ago
on
June 30, 2023
| 133 views
-->
By
Chris Dickert
Graphics & Design
Published
23 mins ago
on
June 30, 2023
| 133 views
-->
By
Chris Dickert
Graphics & Design
![]()
Subscribe to the Elements free mailing list for more like this
How Old Are the World’s Nuclear Reactors?
This was originally posted on Elements. Sign up to the free mailing list to get beautiful visualizations on real assets and resource megatrends each week.
Since the advent of nuclear electricity in the 1950s, nuclear reactors have played an essential role in meeting our rising energy needs.
Published
2 hours ago
on
June 28, 2023
| 41 views
-->
By
Marcus Lu
Graphics & Design