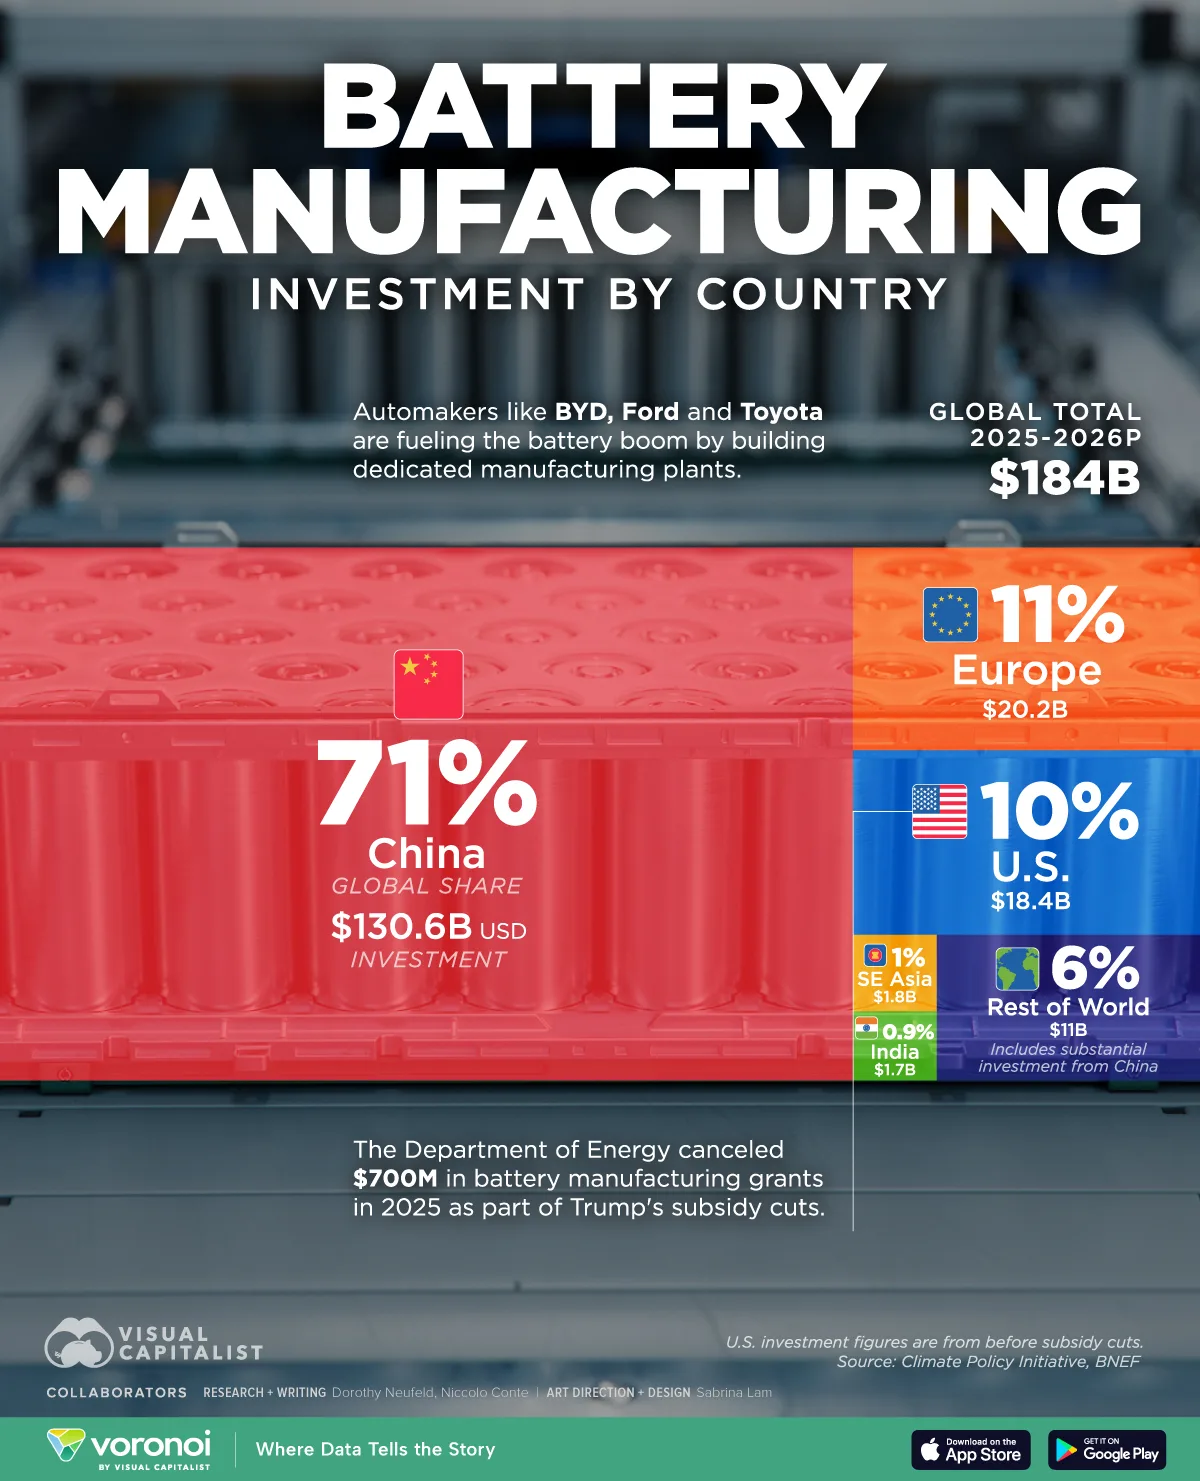
Ranked: Battery Manufacturing Investment by Country
![]()
See more visualizations like this on the Voronoi app.
Use This Visualization
Ranked: Battery Manufacturing Investment by Country
![]()
See more visualizations like this on the Voronoi app.
Use This Visualization
Ranked: Battery Manufacturing Investment by Country
![]()
See more visualizations like this on the Voronoi app.
Use This Visualization
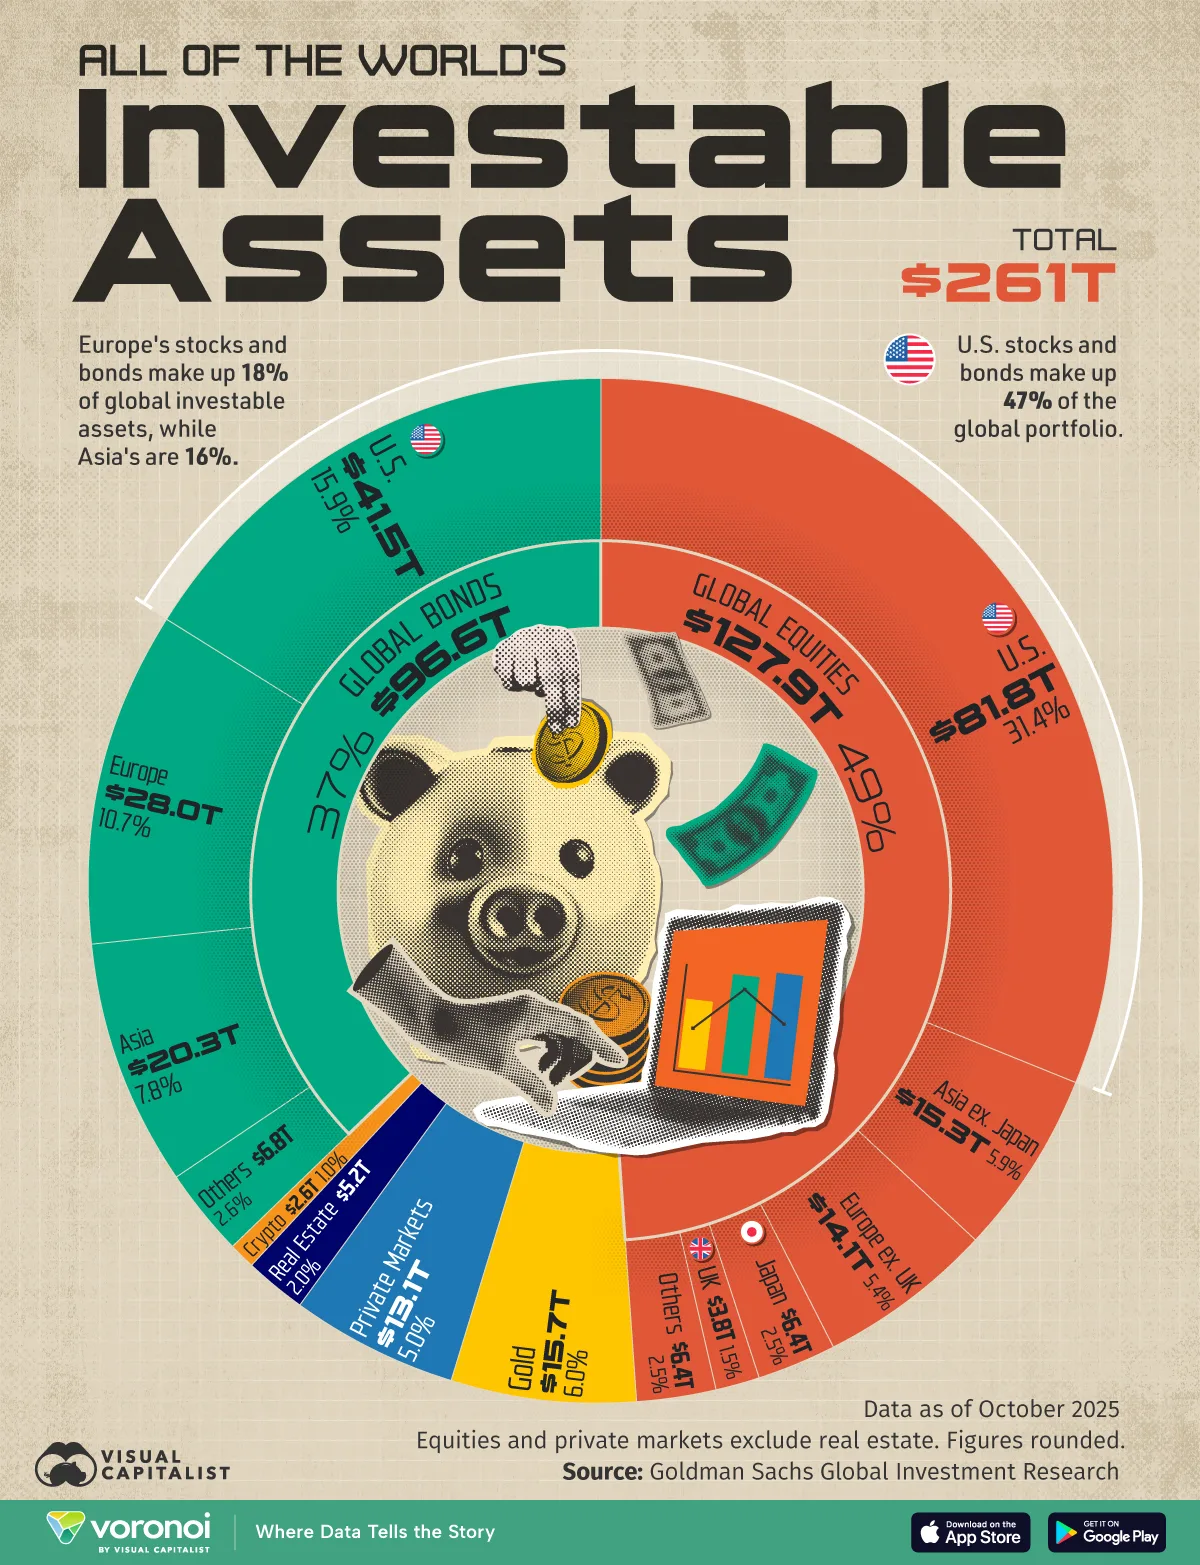
Visualizing $261 Trillion in Global Investment Assets
See visuals like this from many other data creators on our Voronoi app. Download it for free on iOS or Android and discover incredible data-driven charts from a variety of trusted sources.
See the high-resolution version of this image by clicking here
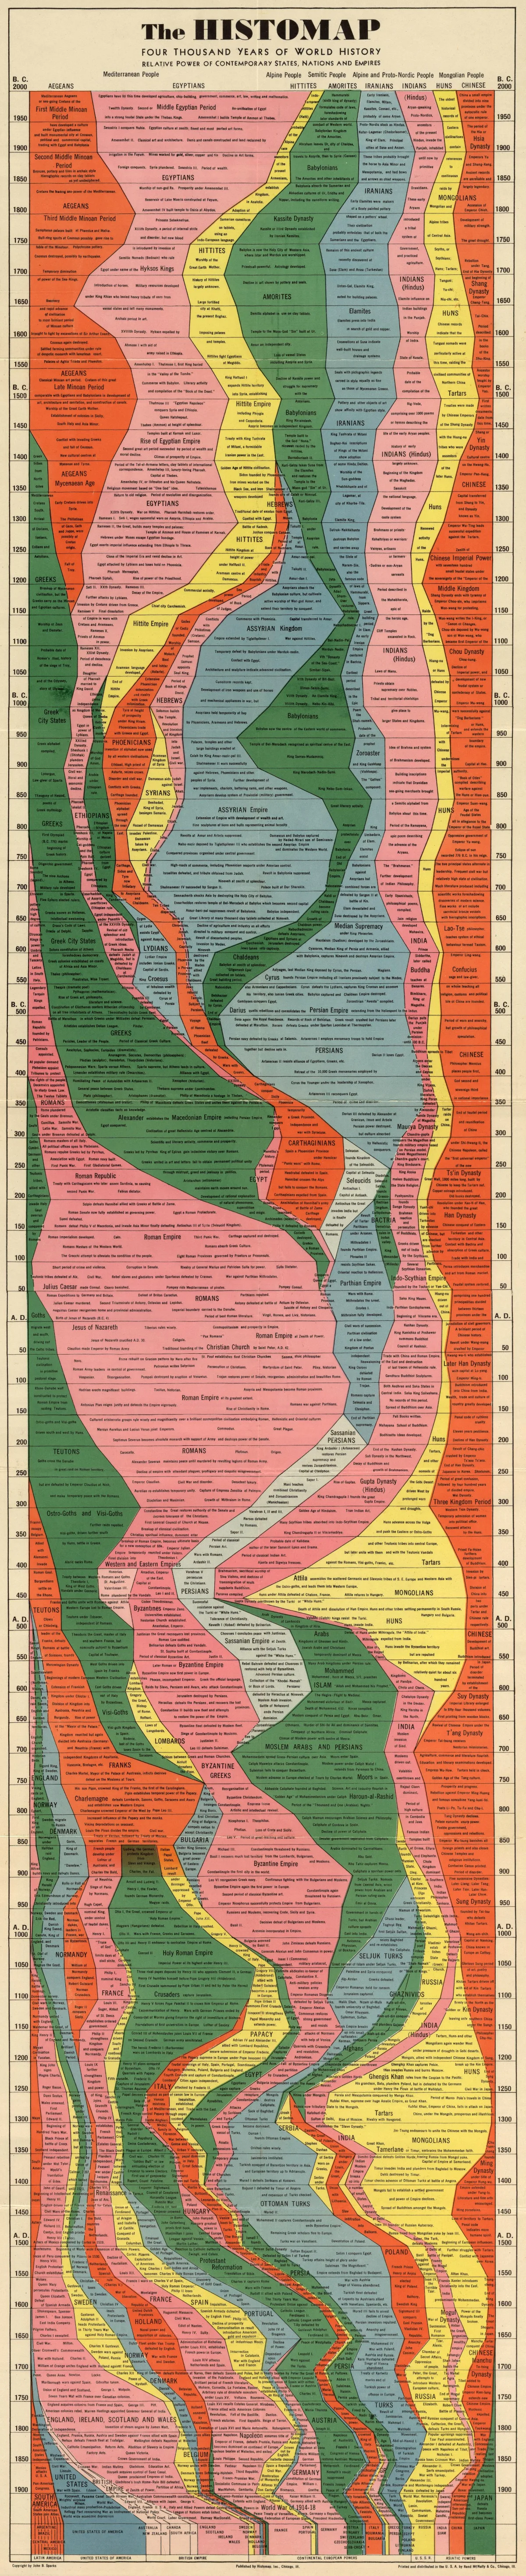
The Rise and Fall of Civilizations, on One Epic Visual Timeline
See visuals like this from many other data creators on our Voronoi app. Download it for free on iOS or Android and discover incredible data-driven charts from a variety of trusted sources.
Key Takeaways
![]()
See more visualizations like this on the Voronoi app.
Use This Visualization
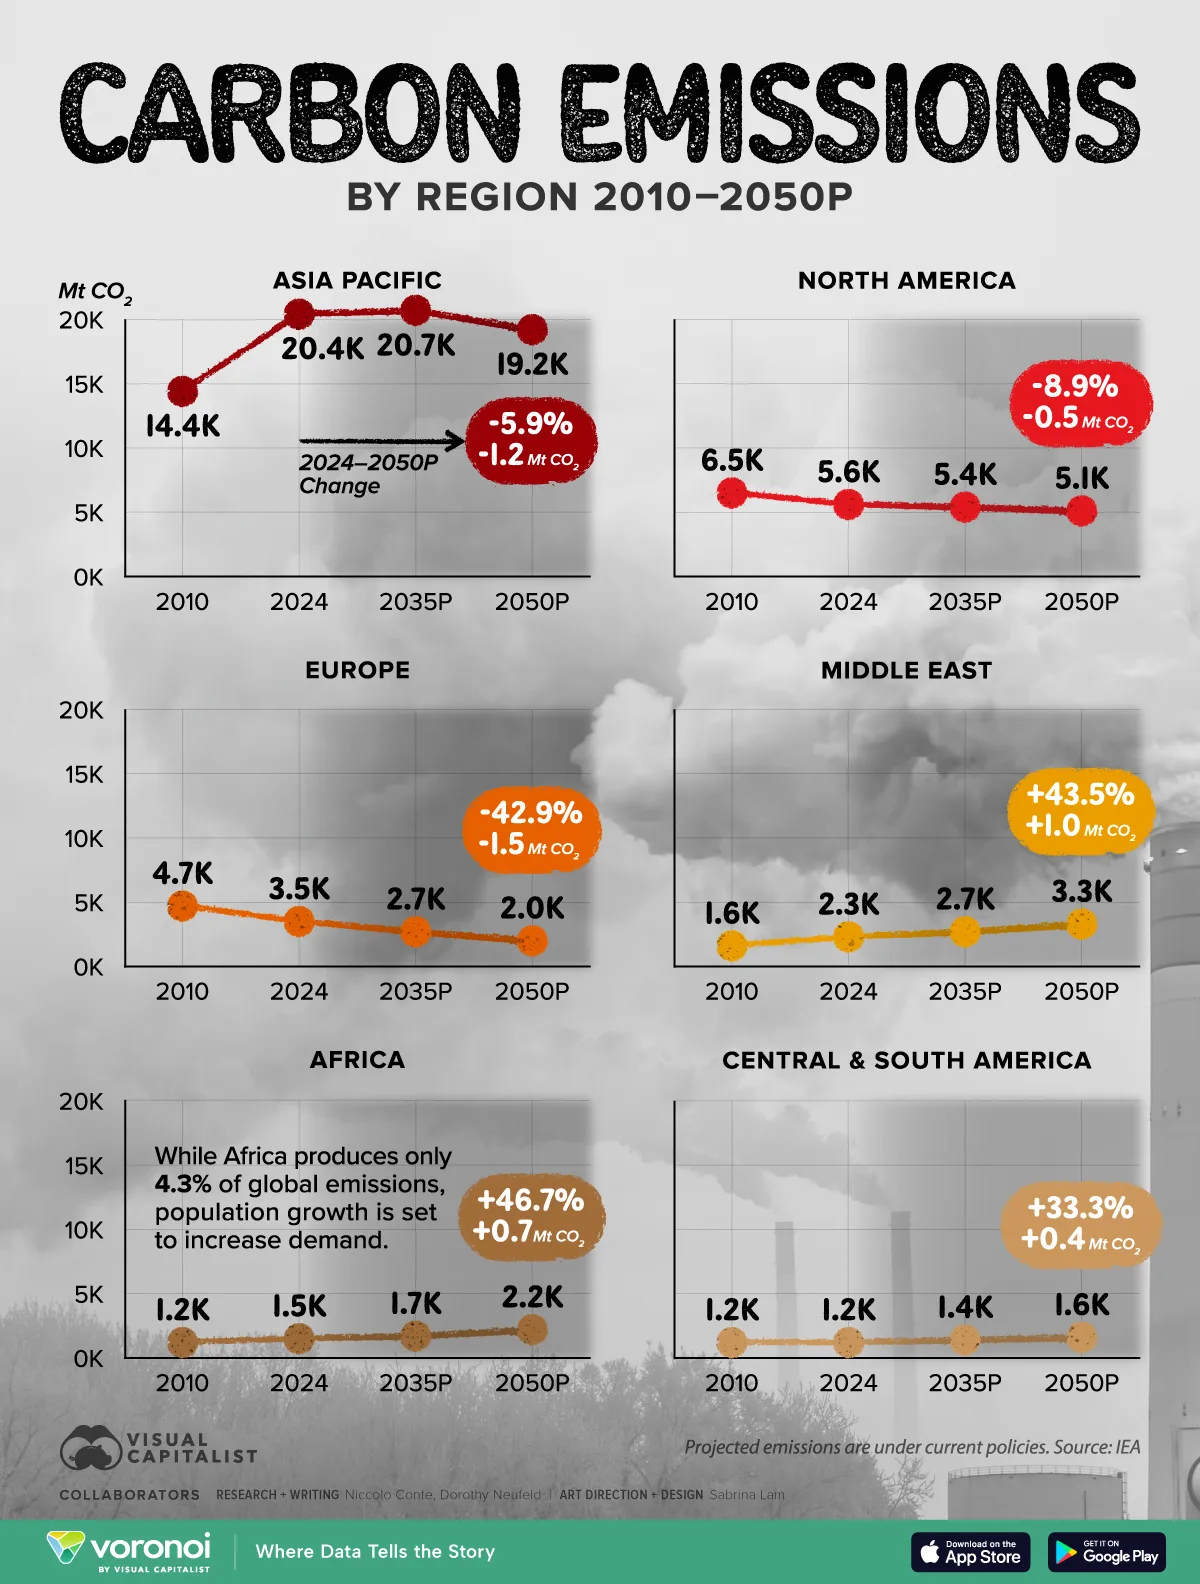
Carbon Emissions by Region 2010-2050P
See visuals like this from many other data creators on our Voronoi app. Download it for free on iOS or Android and discover incredible data-driven charts from a variety of trusted sources.
![]()
See more visuals like this on the Voronoi app.
Use This Visualization
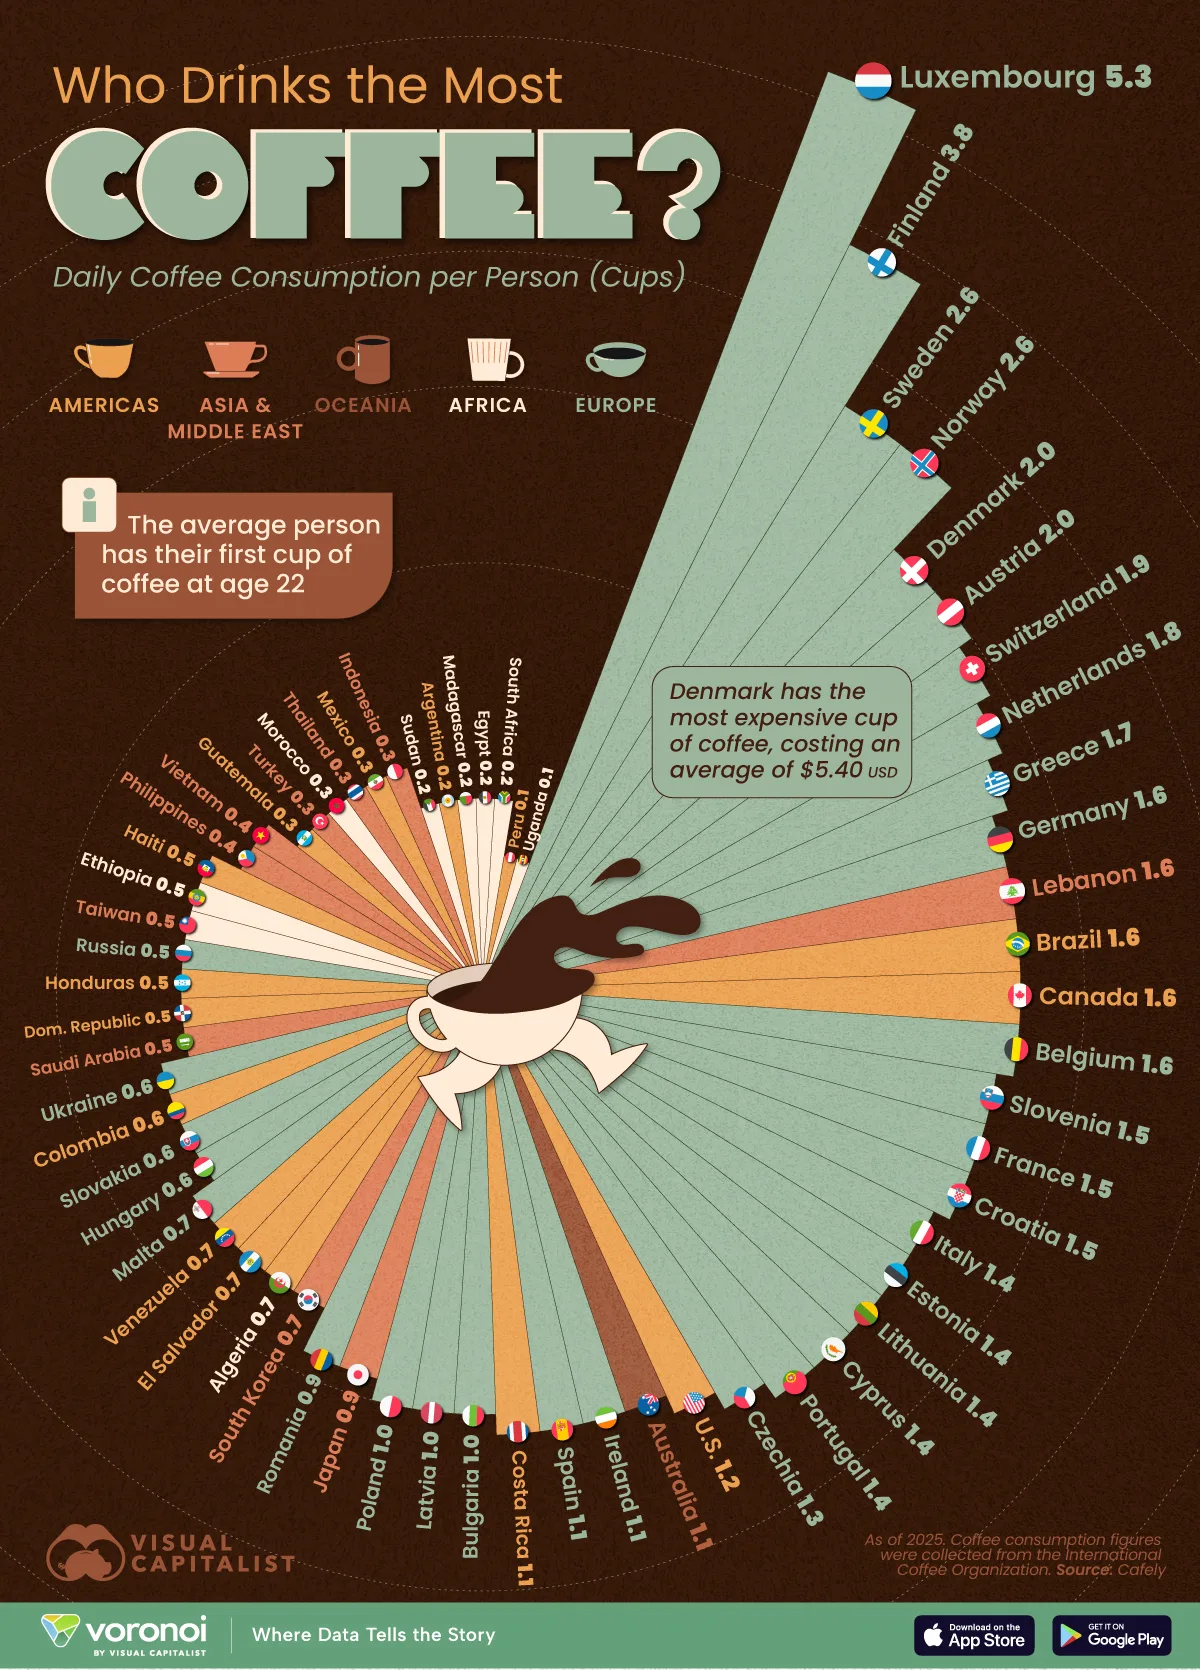
Ranked: Which Country Consumes the Most Coffee in 2025
This was originally posted on our Voronoi app. Download the app for free on iOS or Android and discover incredible data-driven charts from a variety of trusted sources.
Key Takeaways