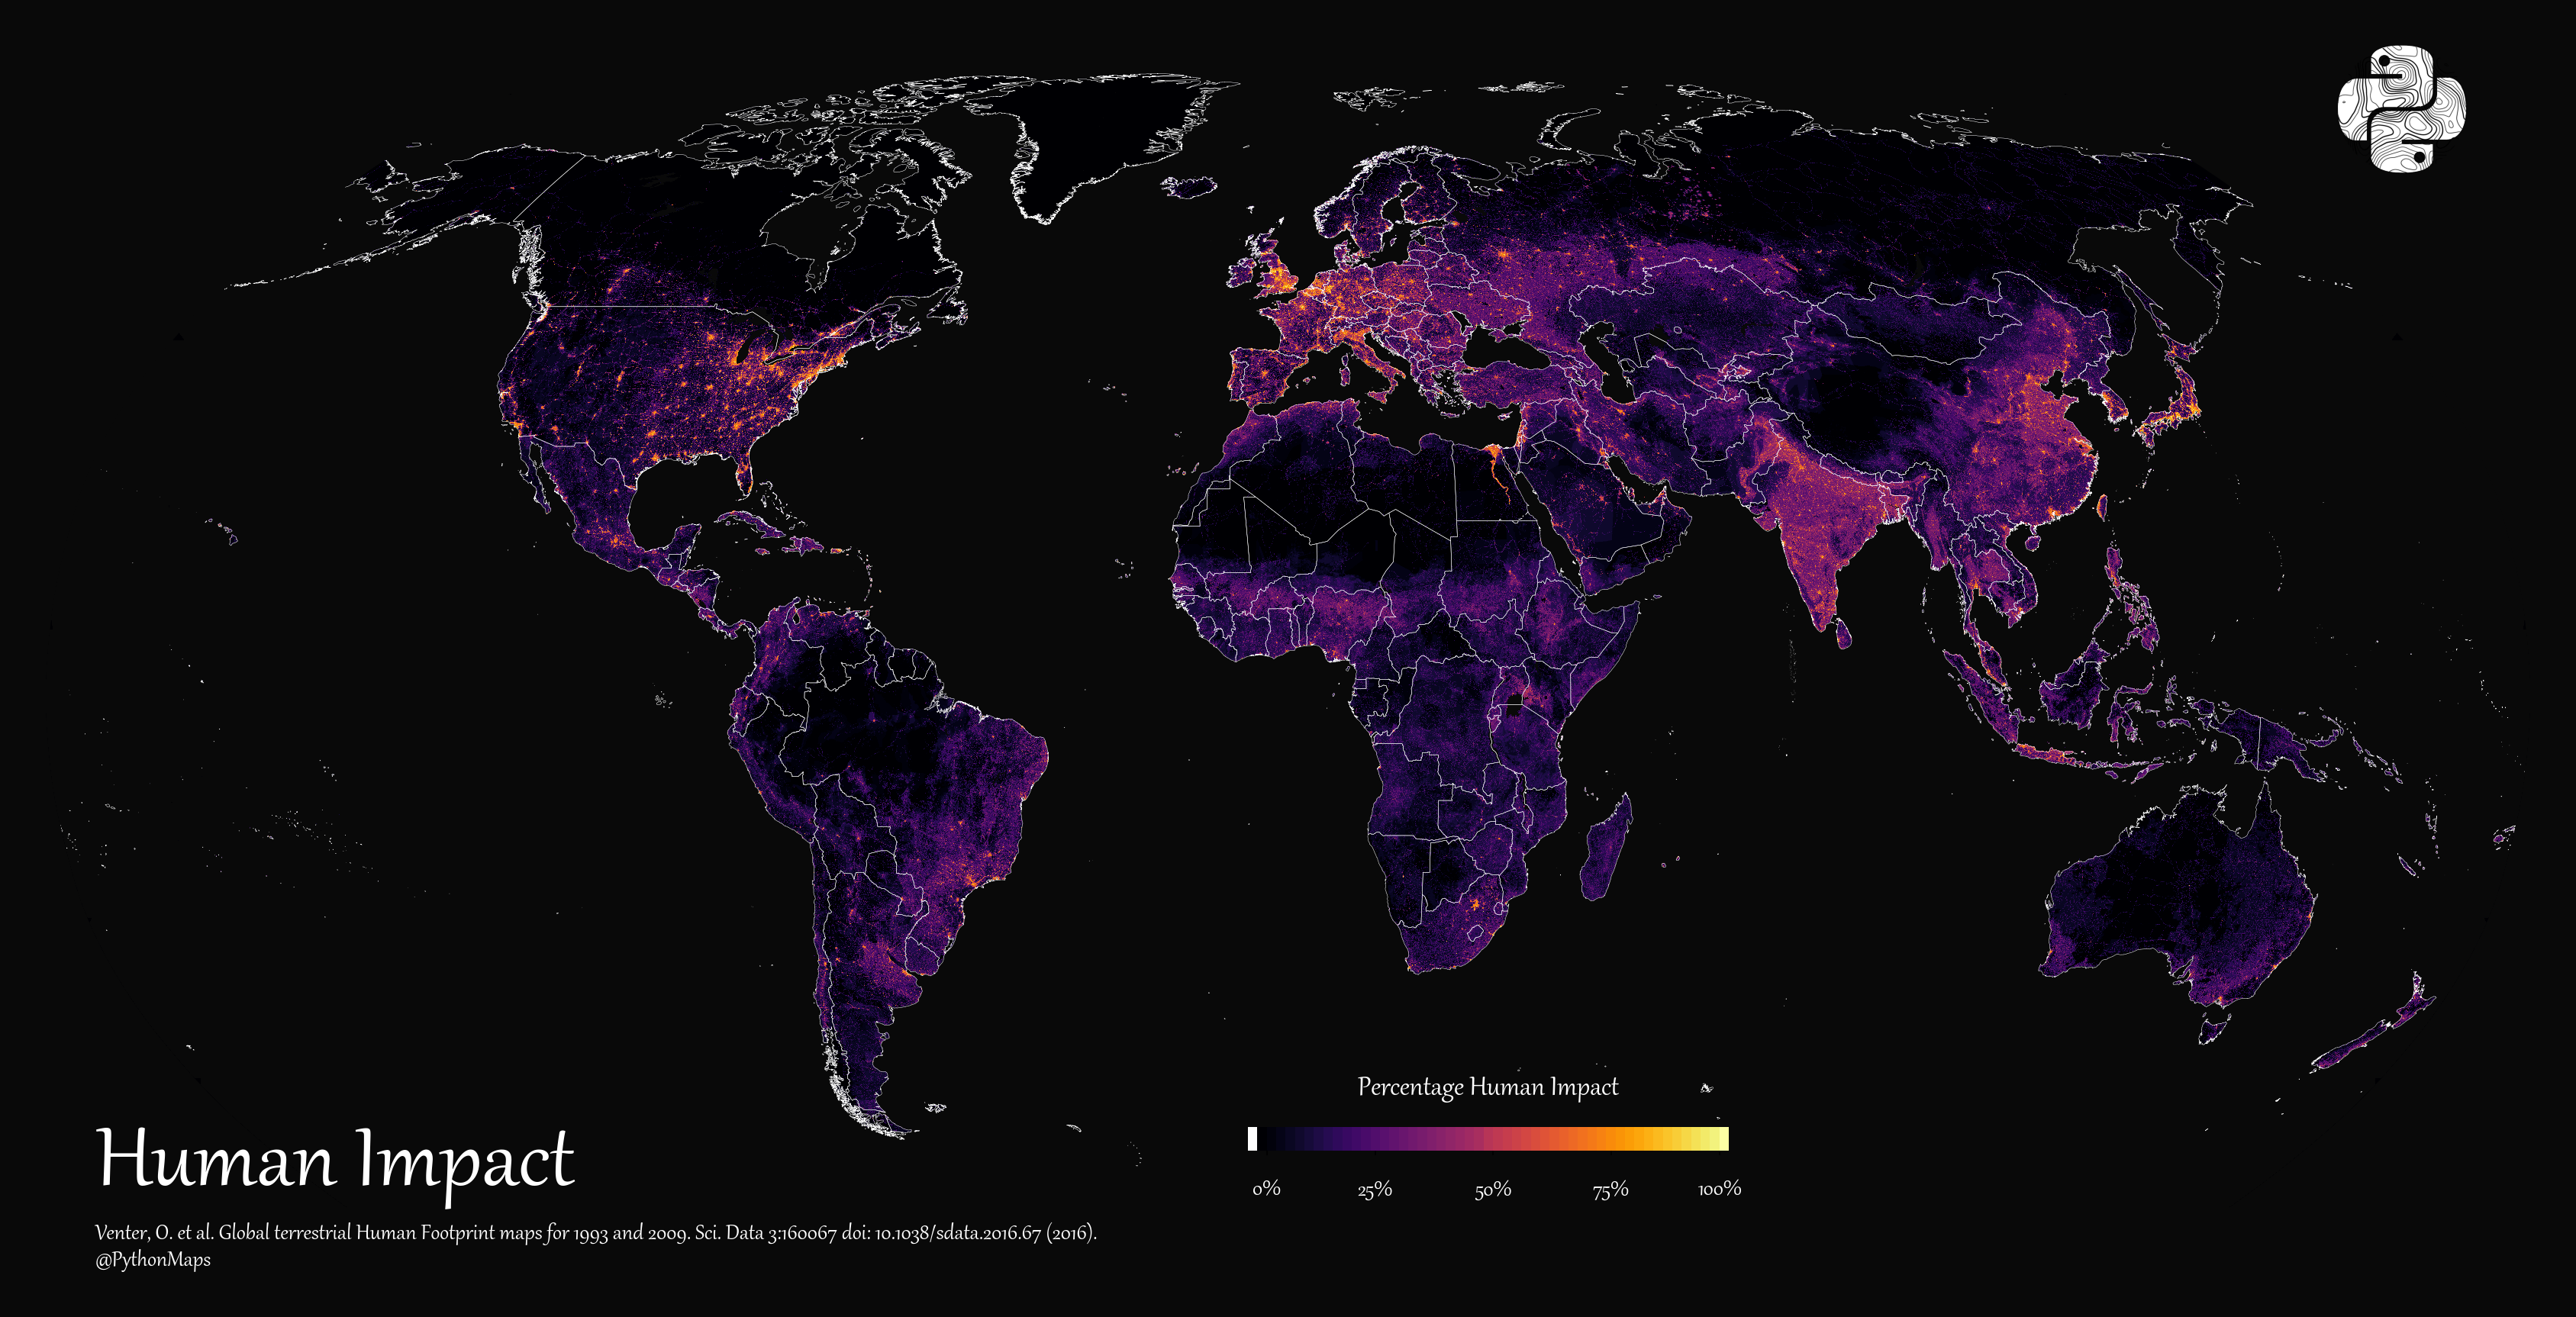
You are here

South America

Visualized: The State of Central Bank Digital Currencies

Can I share this graphic?Yes. Visualizations are free to share and post in their original form across the web—even for publishers. Please link back to this page and attribute Visual Capitalist.

When do I need a license?Licenses are required for some commercial uses, translations, or layout modifications. You can even whitelabel our visualizations. Explore your options.

Interested in this piece?Click here to license this visualization.

Visualizing the Impact of Rising Sea Levels, by Country

Climate change is already causing sea levels to rise across the globe. In the 20th century alone, it’s estimated that the mean global sea level rose by 11-16 cm.

How much will sea levels change in the coming years, and how will it affect our population?

In the below series of visualizations by Florent Lavergne, we can see how rising sea levels could impact countries in terms of flood risk by the year 2100.

Pages