Gold Glows As Stocks Suffer Longest Losing Streak Since 2011
So much excitment but by the end of the month...
Some high-/low-lights for February...
So much excitment but by the end of the month...
Some high-/low-lights for February...

The gold to silver ratio moved up very sharply this week, +4.2%. How did this happen? It was not because of a move in the price of gold, which barely budged this week. It was due entirely to silver being repriced 66 cents lower.
This ratio is now 83.2. It takes 83.2 ounces of silver to buy an ounce of gold. Conversely, it takes 1/83.2oz (about 0.37 grams) of gold to buy an ounce of silver.
This ratio is now within a hair’s breadth of breaking out past the high set on Oct 17, 2008. See the historical graph (based on LBMA silver fix and PM gold fix data, provided by Quandl).

We have previously documented how, with the fourth quarter earnings season almost completed, Q4 EPS are poised to drop by 3.3% Y/Y, making this the third consecutive quarter of declining year over year earnings, in other words an earnings recession and a half.
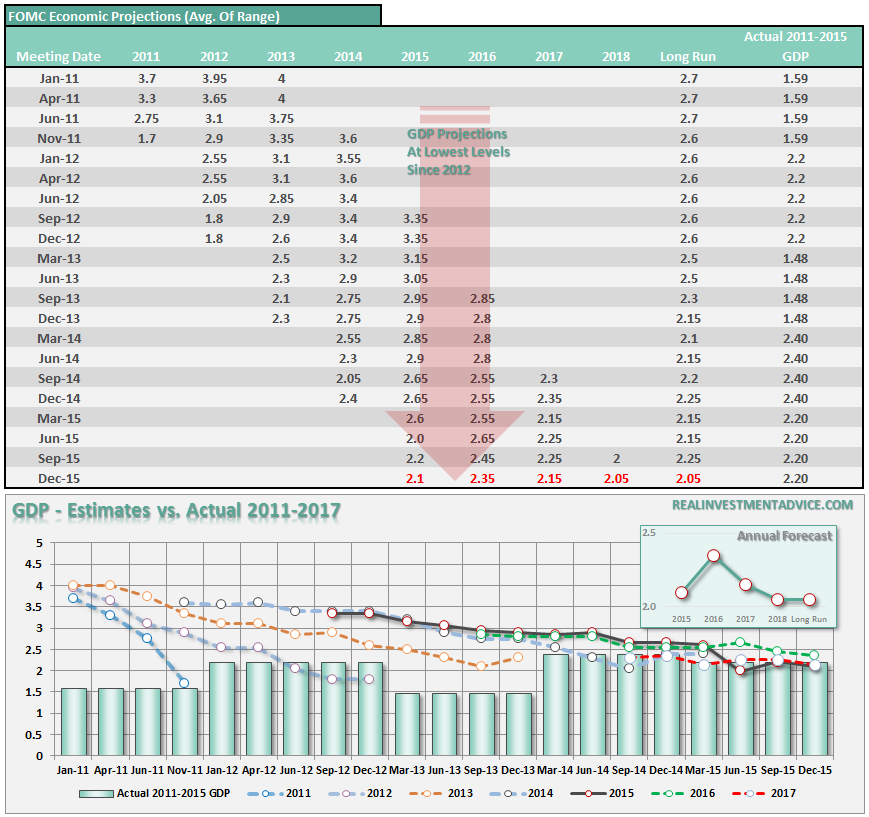
Submitted by Lance Roberts via RealInvestmentAdvice.com,
I was wrong.
I wrote last year that the economists in charge of monetary policy at the Fed were the worst economic forecasters on the planet. To wit:
It is different this time. So far in 2016, there has been 23 days where the S&P 500 has moved +/- 1%. To put that in context, in the last 60 years, no other year has started off with such volatility.
2016 has been busy...
2016 is now the "most volatile" year on record...
And for those wondering about VIX in context - S&P Implied Vol just dropped back to its historical volatility, which is picking up once again.