Intraday Trading Indicator Showing Shades Of 2000, 2007 Tops
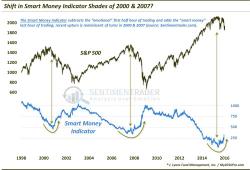
Via Dana Lyons' Tumblr,
An indicator based on the first hour versus last hour of stock trading has undergone a shift similar to those seen at the prior 2 cyclical tops.

Via Dana Lyons' Tumblr,
An indicator based on the first hour versus last hour of stock trading has undergone a shift similar to those seen at the prior 2 cyclical tops.
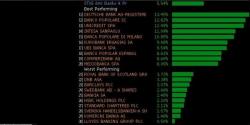
While algos patiently await the only thing that matters for US stocks today which is Janet Yellen's testimony before Congress. expected to be released at 8:30 am (and previewed here), the rest of the world this morning is a hot mess of schizophrenic highs and lows.
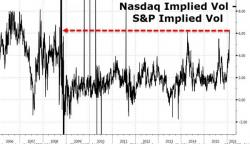
With the "generals" finally meeting their reality-maker, investors appear to be questioning the DotCom bubble-like highs as momentum collapses. "Exuberance has turned to panic pretty quickly," notes one asset manager and after a very rapid plunge in recent days, options traders are piling into protection at a pace not seen since Q4 2008.
The Nasdaq-S&P implied vol spread is more than double its 5 year average...
(ignore the spikes as they represent rolls as opposed to trends)
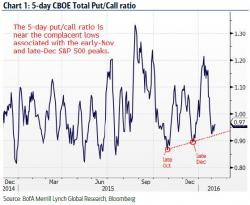
The S&P 500 is down 8.02% YTD through the first five sessions of February. This is the second worst start to the year going back to 1928 and the weakest since 2008, when the S&P 500 dropped 8.95% YTD through the first five days of February. This, as BofAML's Stephen Suttmeier details, compares to an average 1.16% gain for this period. The S&P 500 also has bearish signals for the Nov-Jan and January barometers. This is a risk for 2016.
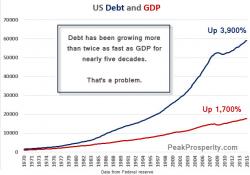
Submitted by Chris Martenson via PeakProsperity.com,
Financial markets the world over are increasingly chaotic; either retreating or plunging. Our view remains that there’s a gigantic market crash in the coming future -- one that has possibly started now.
Our reason for expecting a market crash is simple: Bubbles always burst.