![]()
See this visualization first on the Voronoi app.
Use This Visualization
Mapped: U.S. Cities With The Most DUIs
This was originally posted on our Voronoi app. Download the app for free on iOS or Android and discover incredible data-driven charts from a variety of trusted sources.
Key Takeaways
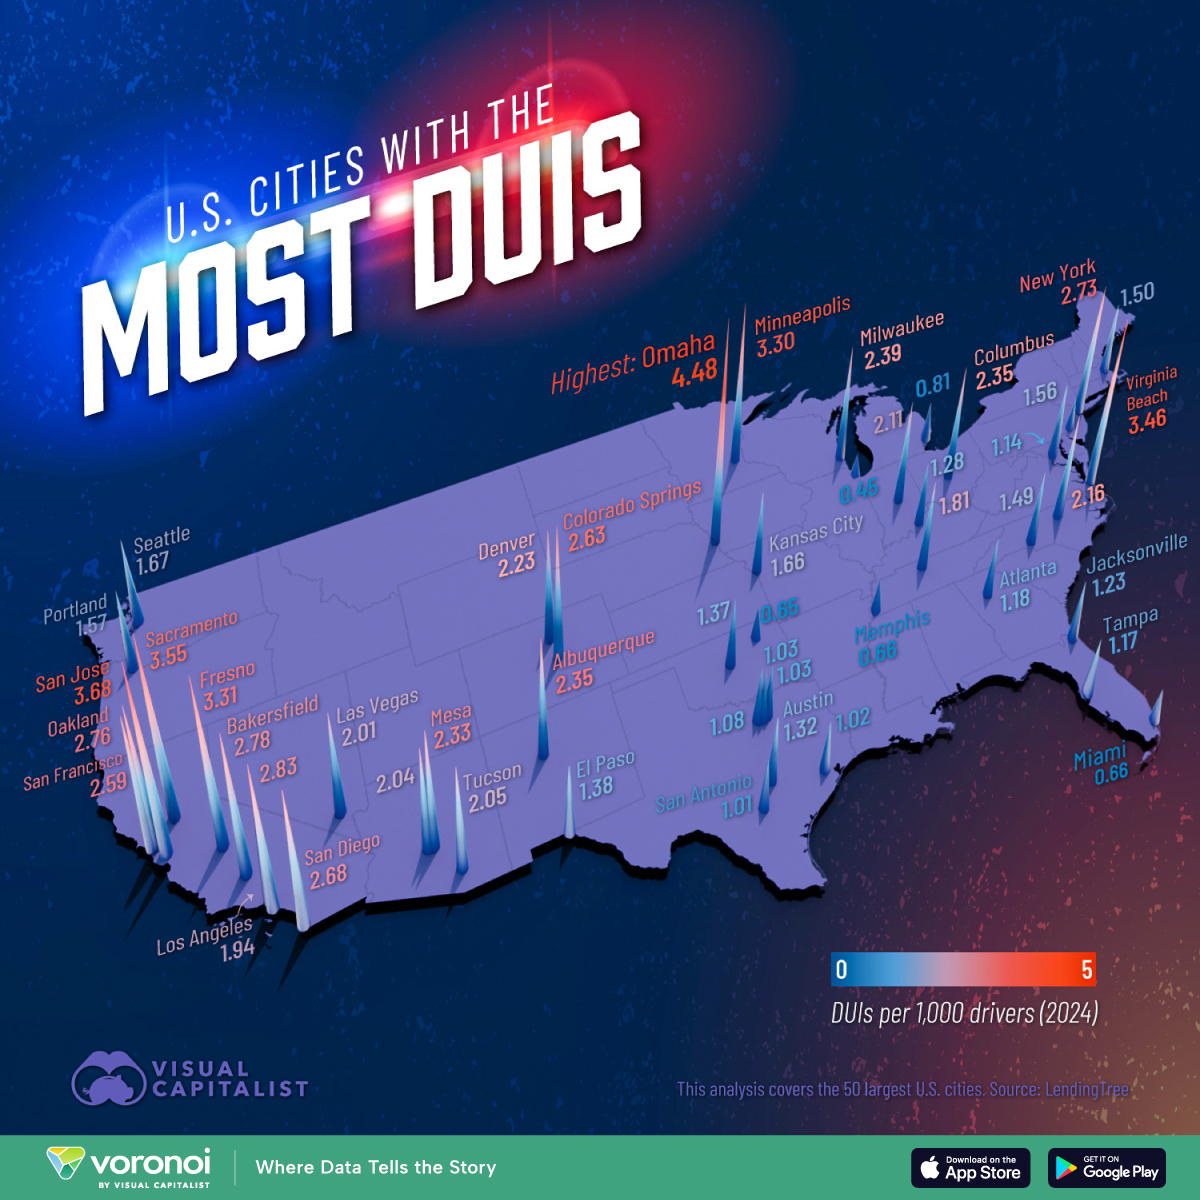
- Among America’s 50 largest cities, Omaha has the most DUIs per 1,000 drivers at 4.48.
- Many Californian cities round out the top 10, including but not limited to San Jose (3.68), Sacramento (3.55), and Fresno (3.31).
Driving under the influence of alcohol remains a serious public safety issue across the United States. According to the NHTSA, 34 people across the country die every day from drunk-driving crashes.
In this visualization, we show the rate of DUIs per 1,000 drivers across America’s 50 biggest cities, based on an analysis conducted by LendingTree.
Data & Discussion
The data for this visualization is based on LendingTree’s analysis of “tens of millions” of insurance quotes from 2024.
They ranked the 50 largest U.S. cities by the number of DUI violations per 1,000 drivers, highlighting regional differences in driving behavior and law enforcement.
| Rank | City | State | DUIs per 1,000 Drivers |
|---|---|---|---|
| 1 | Omaha | NE | 4.48 |
| 2 | San Jose | CA | 3.68 |
| 3 | Sacramento | CA | 3.55 |
| 4 | Virginia Beach |
VA | 3.46 |
| 5 | Fresno | CA | 3.31 |
| 6 | Minneapolis | MN | 3.3 |
| 7 | Long Beach | CA | 2.83 |
| 8 | Bakersfield | CA | 2.78 |
| 9 | Oakland | CA | 2.76 |
| 10 | New York | NY | 2.73 |
| 11 | San Diego | CA | 2.68 |
| 12 | Colorado Springs |
CO | 2.63 |
| 13 | San Francisco | CA | 2.59 |
| 14 | Milwaukee | WI | 2.39 |
| 15 | Albuquerque | NM | 2.35 |
| 15 | Columbus | OH | 2.35 |
| 17 | Mesa | AZ | 2.33 |
| 18 | Denver | CO | 2.23 |
| 19 | Raleigh | NC | 2.16 |
| 20 | Indianapolis | IN | 2.11 |
| 21 | Tucson | AZ | 2.05 |
| 22 | Phoenix | AZ | 2.04 |
| 23 | Las Vegas | NV | 2.01 |
| 24 | Los Angeles | CA | 1.94 |
| 25 | Nashville | TN | 1.81 |
| 26 | Seattle | WA | 1.67 |
| 27 | Kansas City | MO | 1.66 |
| 28 | Portland | OR | 1.57 |
| 29 | Washington | DC | 1.56 |
| 30 | Boston | MA | 1.5 |
| 31 | Charlotte | NC | 1.49 |
| 32 | El Paso | TX | 1.38 |
| 33 | Oklahoma City |
OK | 1.37 |
| 34 | Austin | TX | 1.32 |
| 35 | Louisville | KY | 1.28 |
| 36 | Jacksonville | FL | 1.23 |
| 37 | Atlanta | GA | 1.18 |
| 38 | Tampa | FL | 1.17 |
| 39 | Baltimore | MD | 1.14 |
| 40 | Fort Worth | TX | 1.08 |
| 41 | Arlington | TX | 1.03 |
| 41 | Dallas | TX | 1.03 |
| 43 | Houston | TX | 1.02 |
| 44 | San Antonio | TX | 1.01 |
| 45 | Detroit | MI | 0.81 |
| 46 | Philadelphia | PA | 0.66 |
| 46 | Memphis | TN | 0.66 |
| 46 | Miami | FL | 0.66 |
| 49 | Tulsa | OK | 0.65 |
| 50 | Chicago | IL | 0.45 |
Omaha Leads the Nation in DUIs
Omaha, Nebraska tops the list with 4.48 DUI violations per 1,000 drivers. That’s nearly 10 times the rate seen in Chicago, which ranks lowest at 0.45.
While it’s hard to say why Omaha took the top spot, possible reasons could include higher car dependency or stricter DUI enforcement. Either way, it stands out significantly from the national average.
California Dominates the Top 10
Six of the top 10 cities with the most DUIs are located in California. San Jose, Sacramento, Fresno, Long Beach, Bakersfield, and Oakland all report high DUI rates ranging from 2.76 to 3.68 per 1,000 drivers.
This may reflect the state’s large population and vehicle-centric culture, though variations in enforcement or reporting practices could also play a role.
Learn More on the Voronoi App ![]()
If you enjoyed today’s post, check out Violent Crime Rates by State on Voronoi, the new app from Visual Capitalist.