If No Debt Ceiling Deal By Early June, Stocks Crash, The Economy Implodes, And Social Security Payments Don’t Go Out


Written By Chris Dickert
Graphics & Design

Subscribe to the Elements free mailing list for more like this
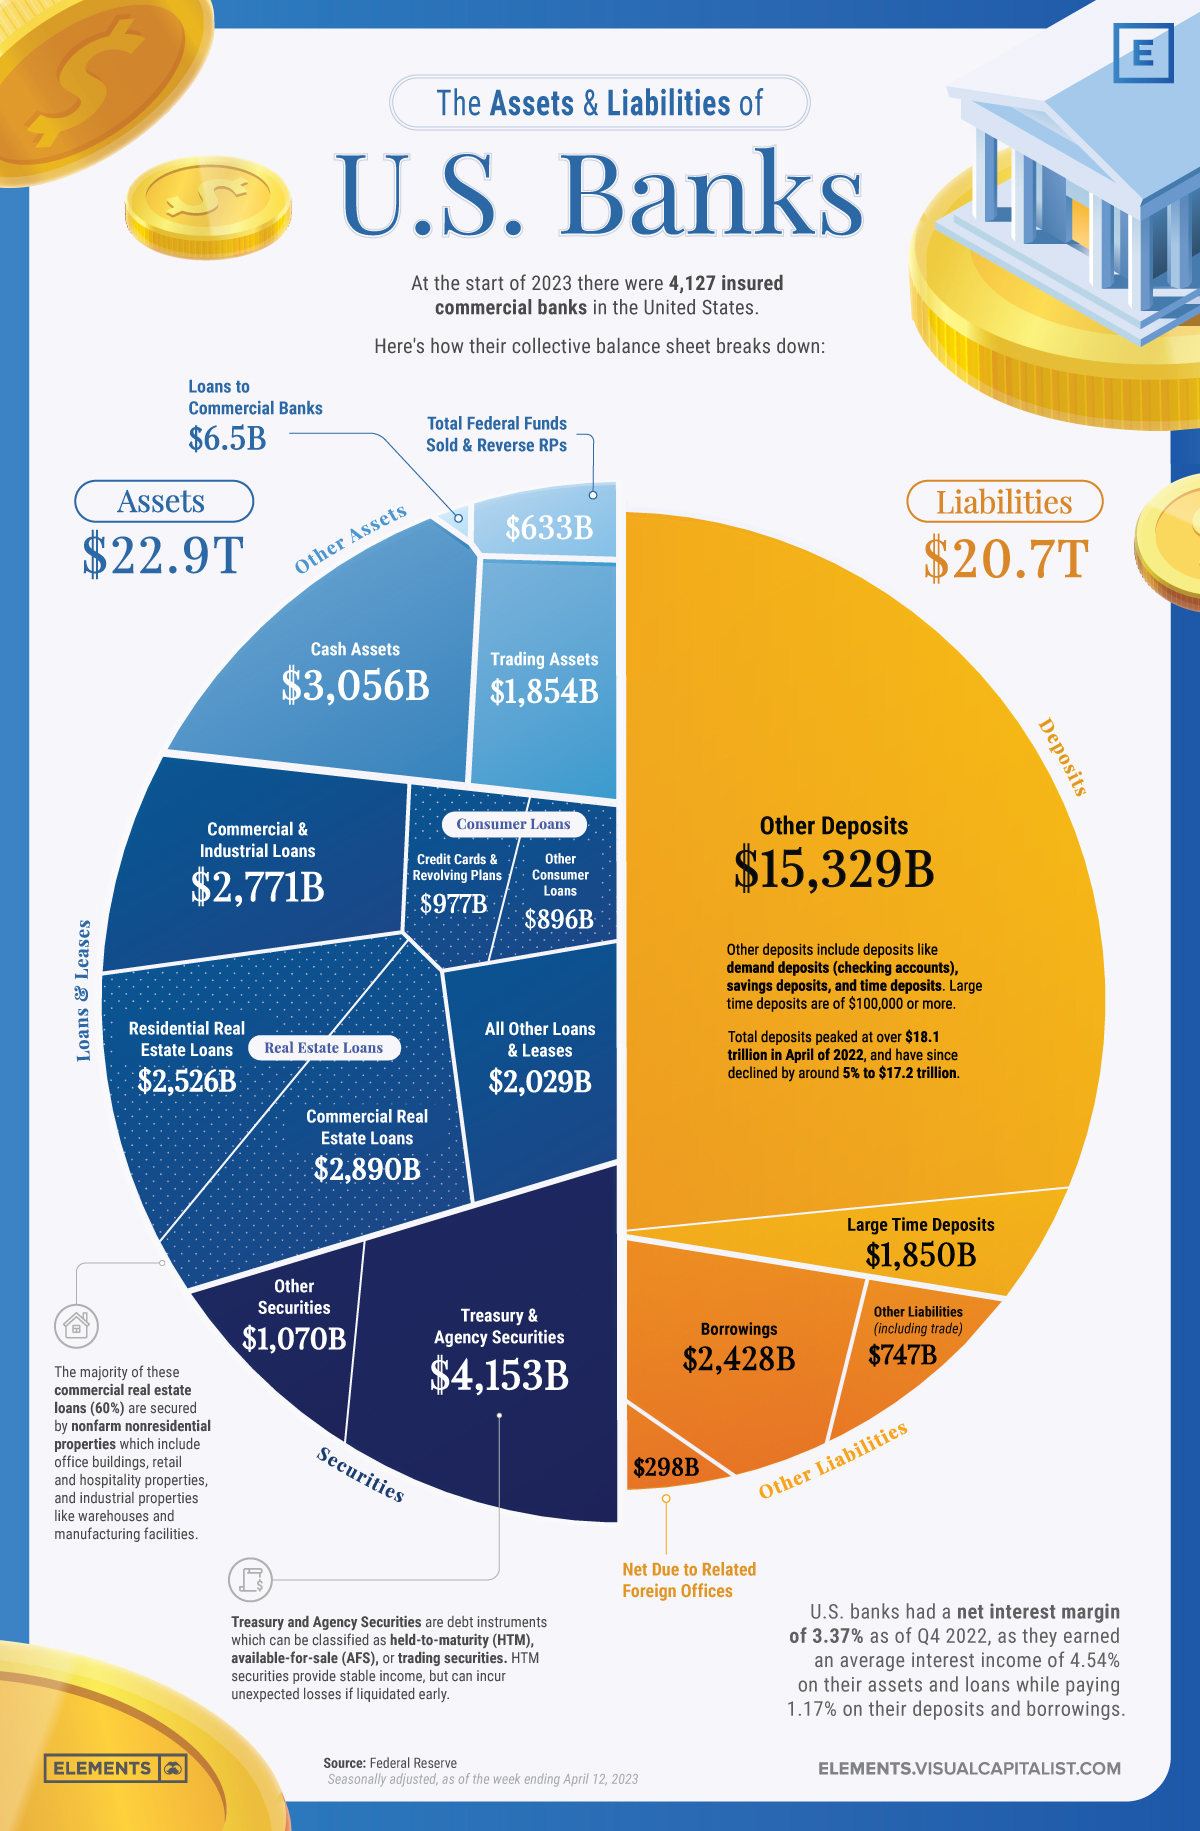
Understanding the Assets and Liabilities of U.S. Banks
This was originally posted on Elements. Sign up to the free mailing list to get beautiful visualizations on real assets and resource megatrends each week.

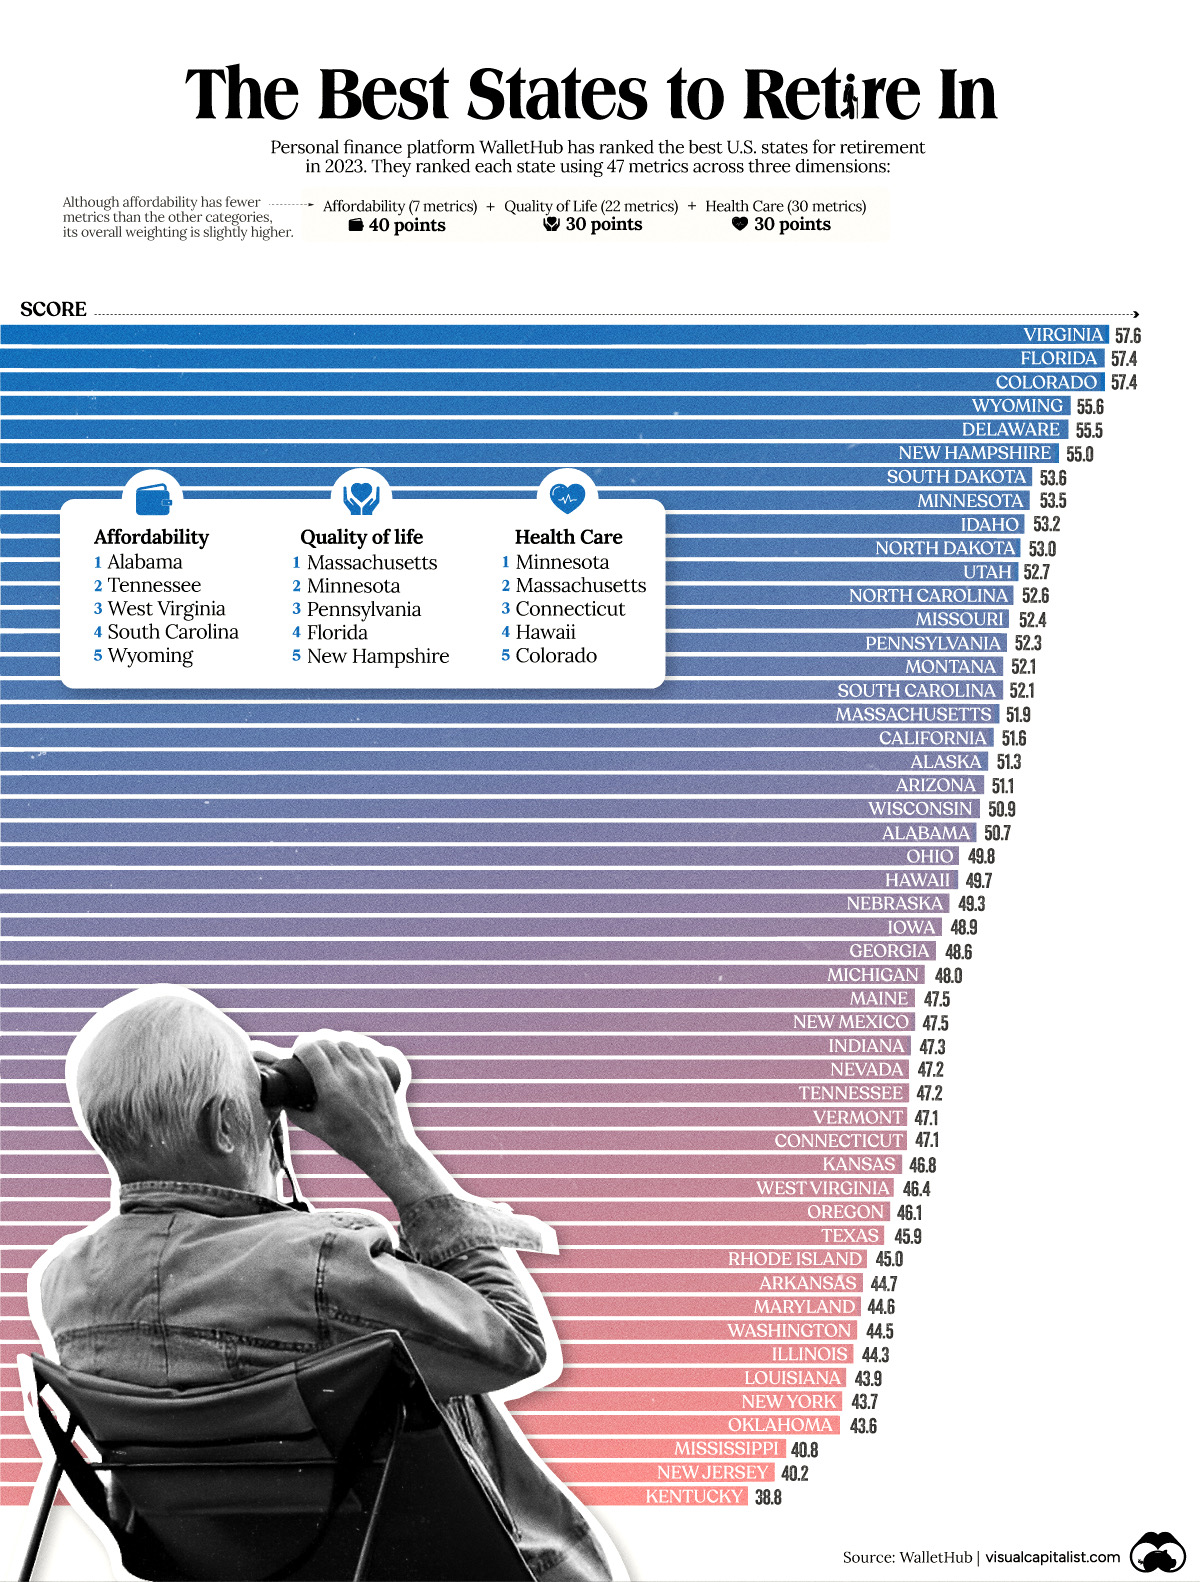
Ranked: The Best U.S. States for Retirement
What is the most important aspect of retirement planning?
If you said finances, you’re probably right. But have you ever thought about where the best place is to retire? Being strategic about location can make a big impact on your quality of life, and perhaps help your savings go just a bit further.