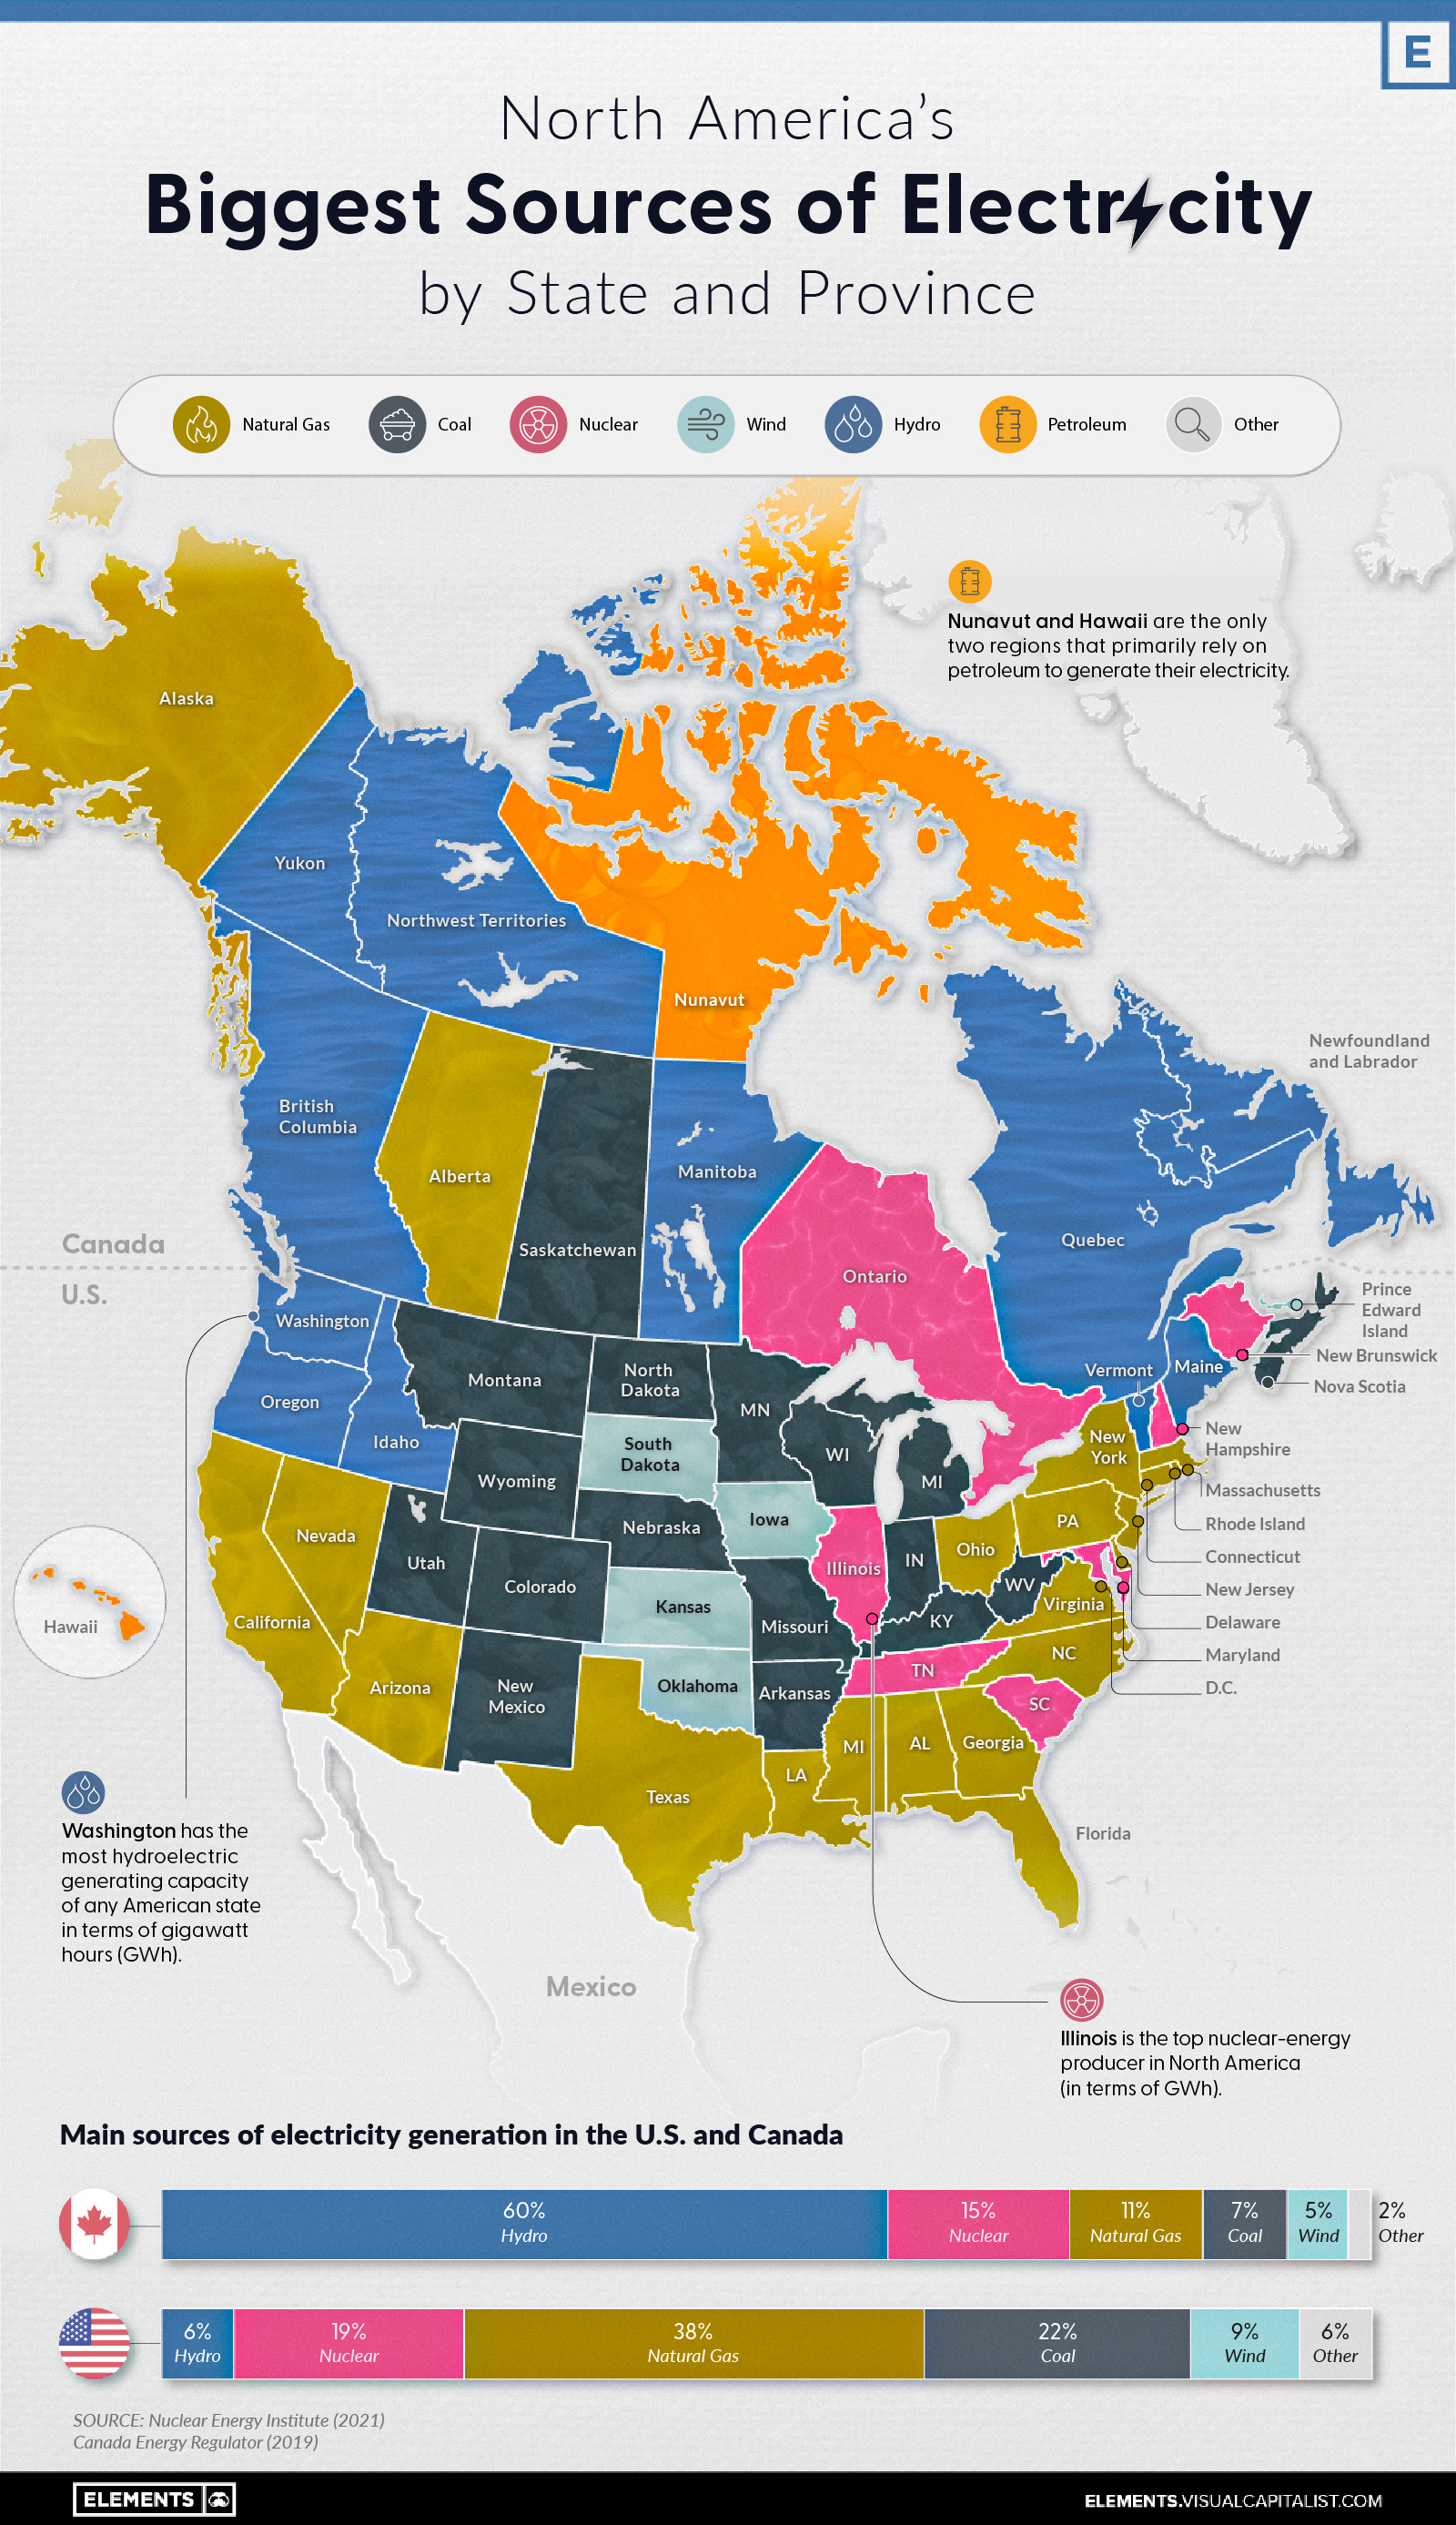
You are here
United States
Animated Chart: America’s Demographics Over 100+ Years
http://player.vimeo.com/video/768270956
Animated: America’s Demographics Over 100+ Years
The United States has famously been called a melting pot, due its demographic makeup of various cultures, races, religions, and languages. But what shape does that mixture take? And how has it changed over time?
U.S. Consumers Are Doing EXACTLY What They Did Just Prior To The Crash Of 2008
The Type of Business Every Country Wants to Start
View a higher resolution version of this map.
The Type of Business Every Country Wants to Start
View a higher resolution version of this map.
Every year, millions of new businesses are started across the world—in 2021, nearly 5.4 million new business applications were filed in the U.S. alone.
The U.S. and China Account for Half the World’s Household Wealth
Measures like GDP are commonly used to understand the overall wealth and size of the economy. While looking at economic output on an annual basis is useful, there are other metrics to consider when evaluating the wealth of a nation.
Household wealth statistics reveal which country’s citizens are accruing the highest level of money and assets worldwide.