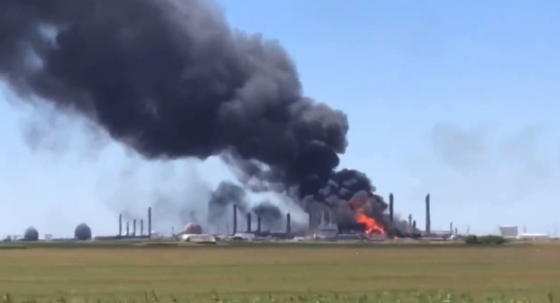
Who Is Behind A Series Of “Mysterious Explosions” At Natural Gas Facilities In The United States?
Click to view a larger version of the graphic.
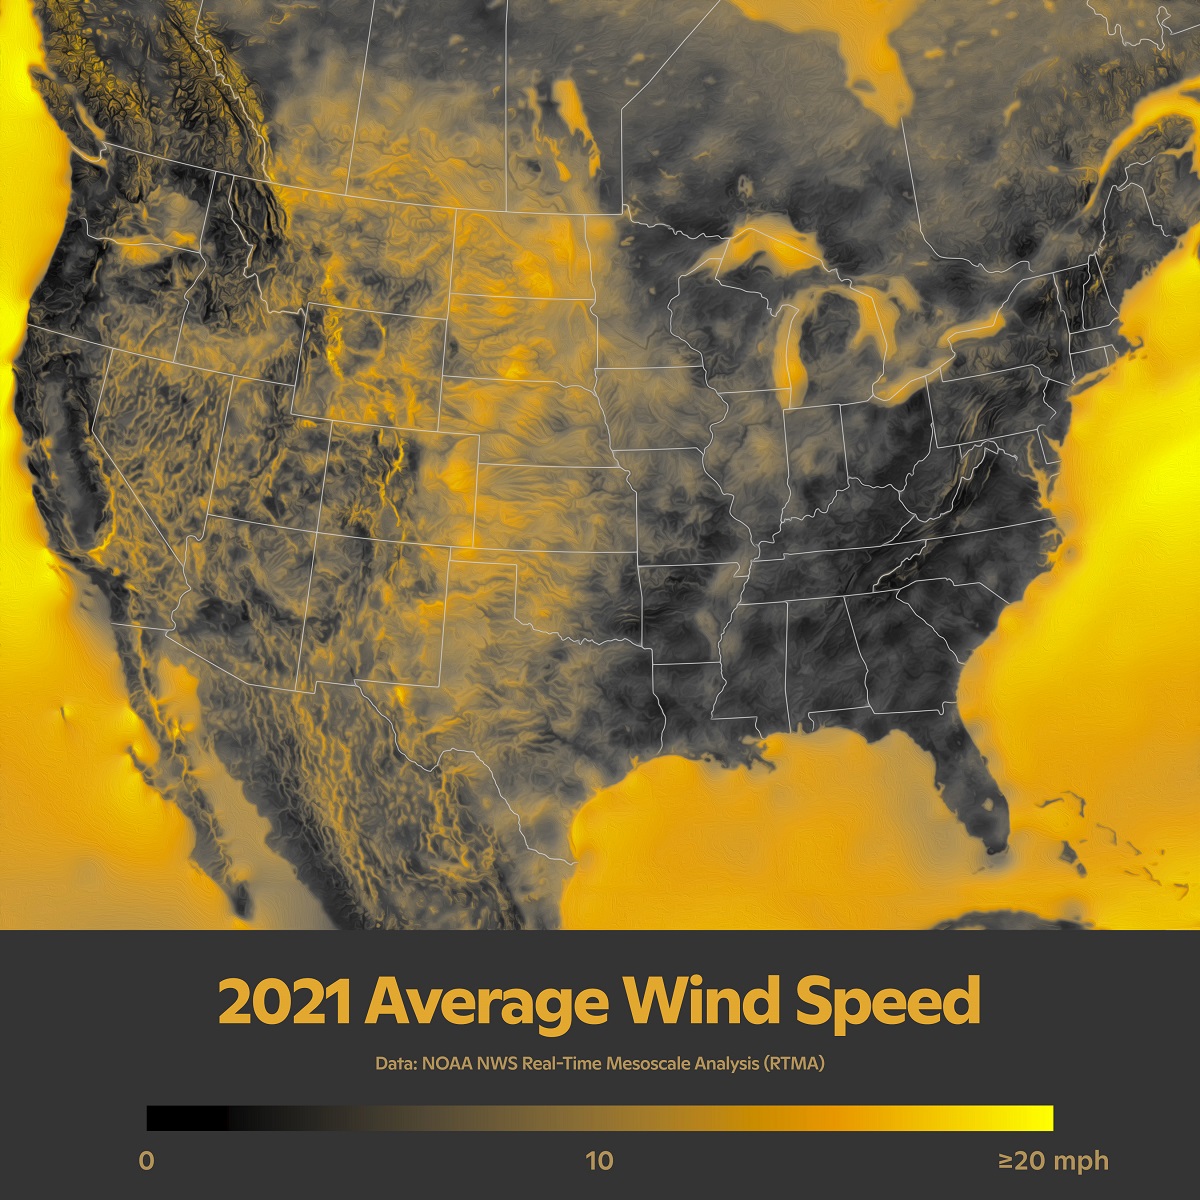
Mapped: Average Wind Speed Across the U.S.
Wind energy is a hot topic in North America and around the world as a decarbonization tool, but full utilization requires a lot of wind.
This graphic from the team at the Woodwell Climate Research Center maps the average wind speed of the continental U.S. based on NOAA data from 2021.
![]()

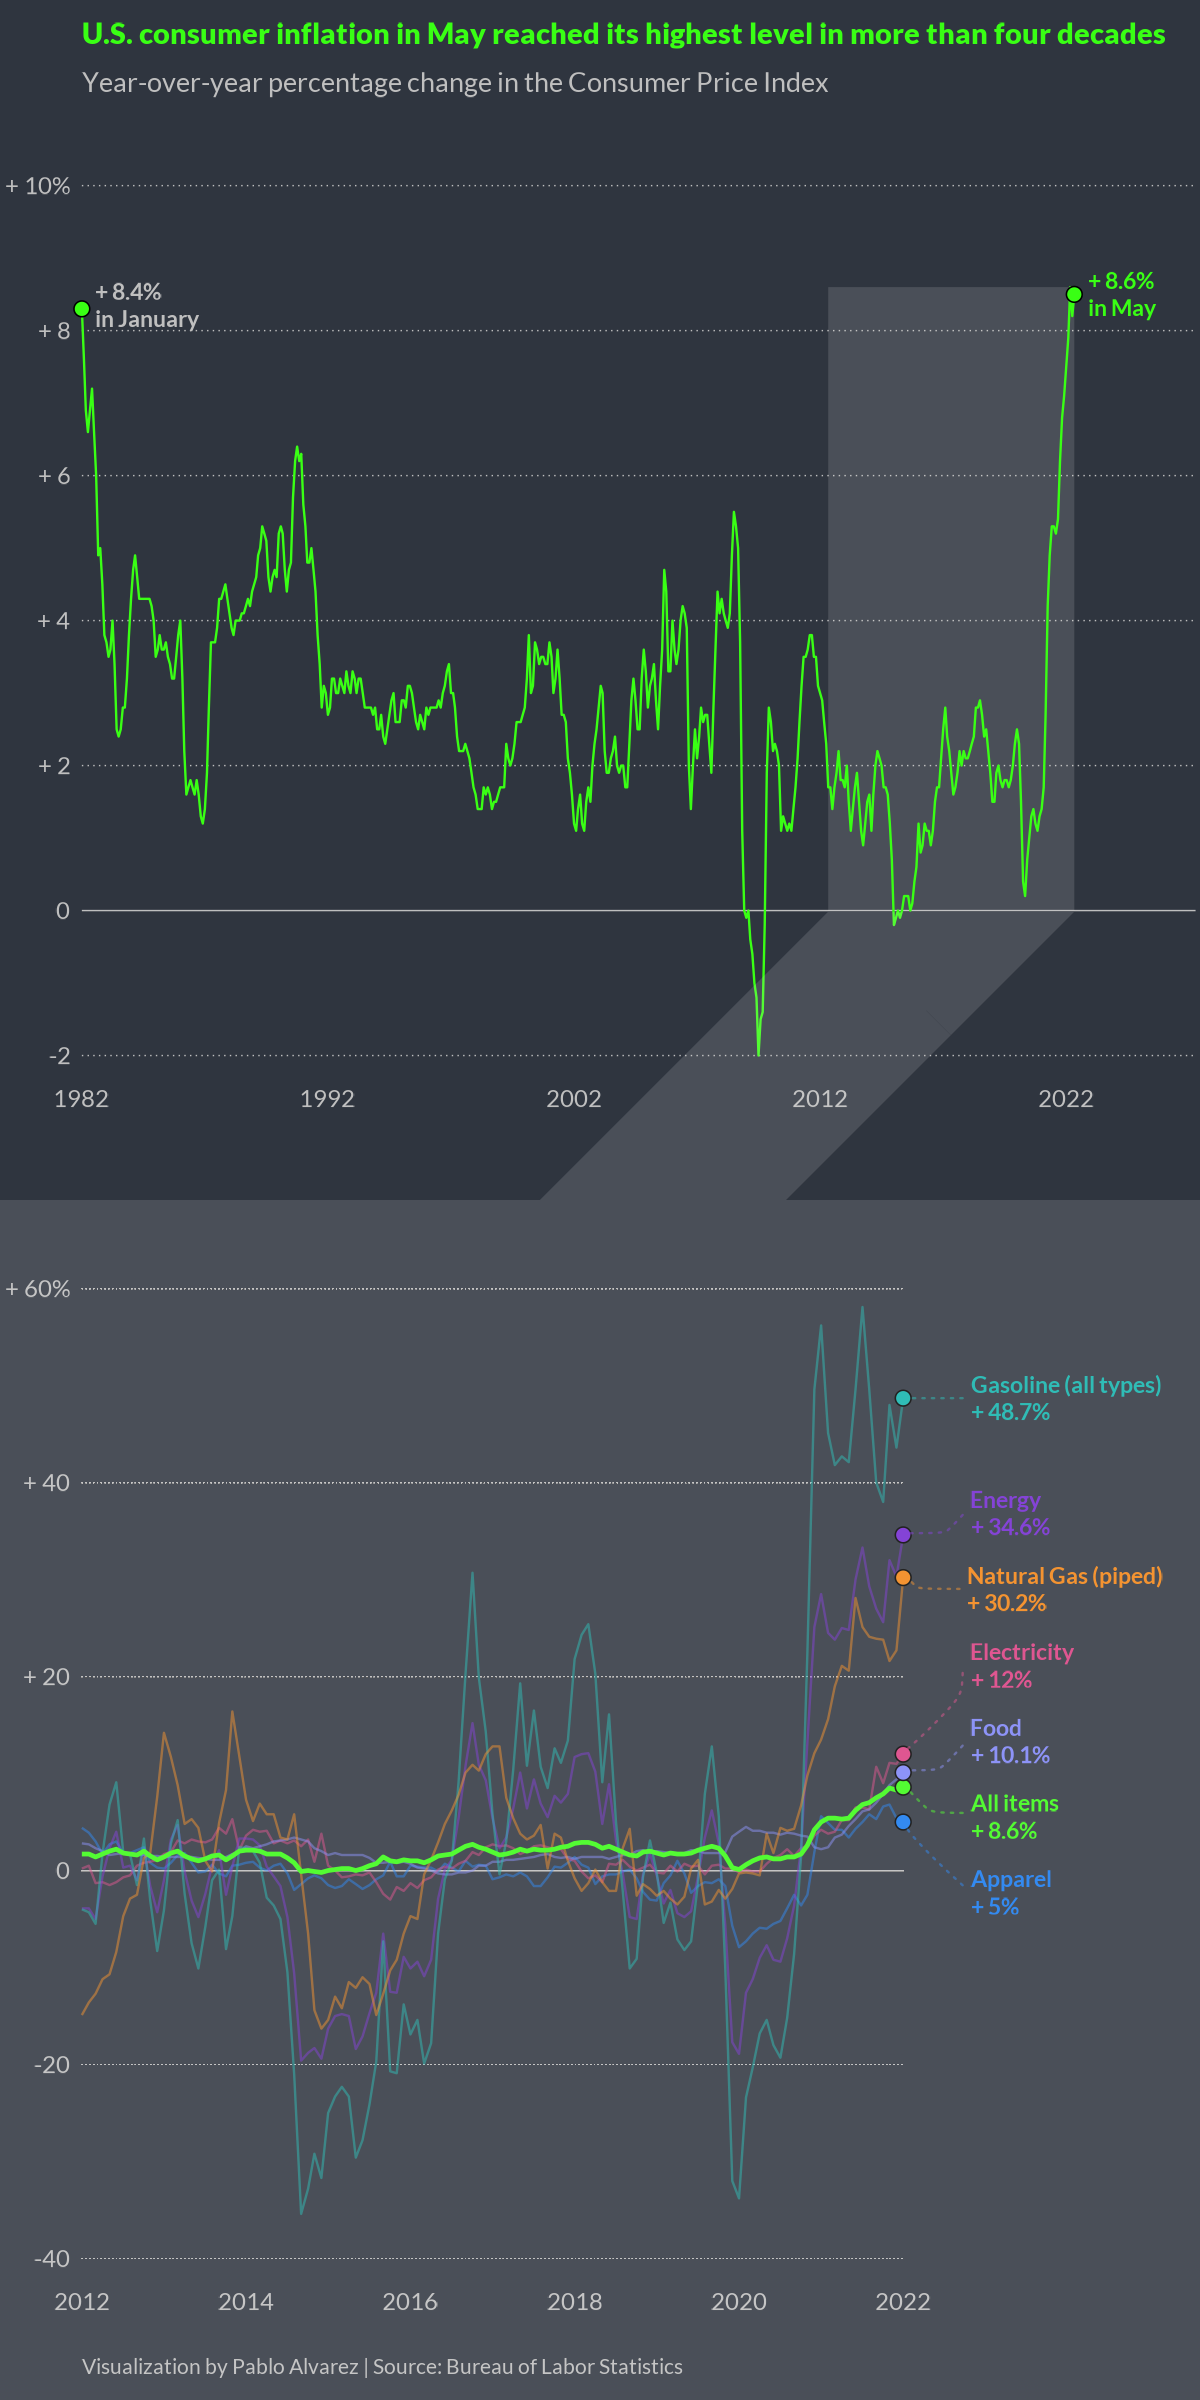
Charted: Four Decades of U.S. Inflation
In May 2022, the annual rate of U.S. inflation grew to 8.6%—the highest it’s been in four decades, according to the Bureau of Labor Statistics.
What’s driving this surge, and what products are seeing the most significant price jumps?
This visualization by Pablo Alvarez shows U.S. inflation levels since 1982 and highlights a few product categories that have seen the biggest year-over-year increases.