Submitted by Lance Roberts via RealInvestmentAdvice.com,
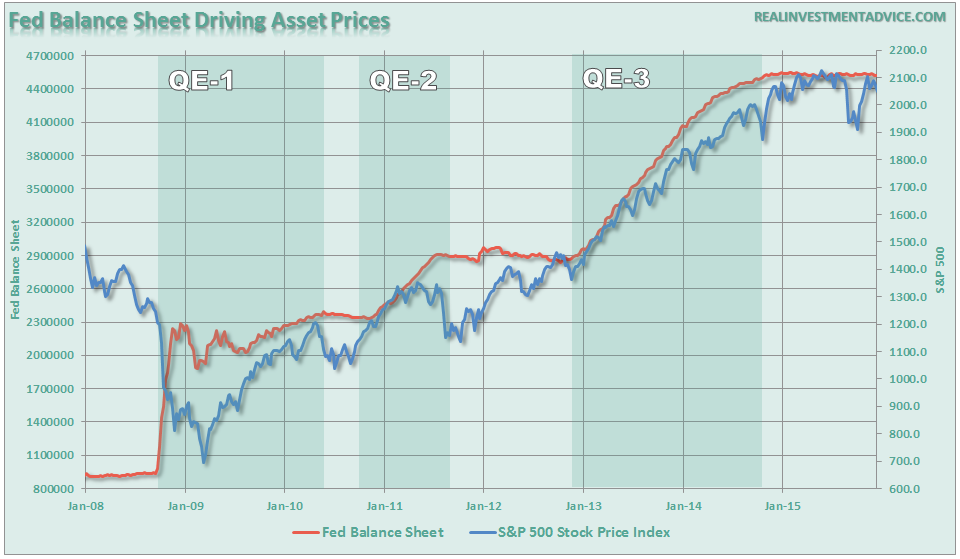
This week, the Fed will meet to decide the “fate of the universe,” as they are highly anticipated to announce the first rate hike in a decade. This is a momentous occasion as it marks the end of the “ultra-accommodative” monetary policy that has been the primary driver behind asset prices since the end of the financial crisis as shown in the chart below.
Importantly, note that the market has struggled, or corrected, whenever liquidity support was absent from the market.
The Federal Reserve has been voicing that “now is the time to raise rates” as employment is improving which is expected to lead to inflationary pressures. This was particularly noted recently by New York Fed President William Dudley, an influential advisor to Janet Yellen, when he stated:
“I think it is quite possible that the conditions the committee has established to begin to normalize monetary policy could soon be satisfied. I see the risks right now of moving too quickly versus moving too slowly as nearly balanced. “
The Federal Reserve has been primarily focused on the unemployment rate and inflationary pressures as the backdrop for needing to raise interest rates. As noted by Mr. Dudley:
“On the other side, there are several risks of delaying the start of lift-off and normalizing more slowly. The first one is that the unemployment rate could fall to an unsustainably low level that is not consistent with our long-run price stability objectives. Monetary policy works with long and variable lags, so overheating is a risk. If overheating did occur, the FOMC might need to tighten monetary policy more aggressively in order to keep inflation from significantly overshooting its 2 percent objective. In such circumstances, the risk of a recession would probably climb significantly. ”
However, while the Fed has focused on unemployment and potential inflation as reasons to hike rates this week, the following 3-charts suggest that they probably shouldn’t.
Inflation Expectations
The Fed wants to be “preemptive” when it comes to potential inflation. As addressed by Mr. Dudley, the risk of surging inflation would lead to rapid rate increases destroying long-term economic longevity.
The problem is that the Fed is looking at economic inflation indicators rather than “professional” inflation forecasters to see if inflation is really on the horizon. Of course, when one says“professional forecasters,” they are not referring to academic economists but rather bond investors who have a definitive financial incentive to accurately forecast goods and services price inflation. As Paul Kasriel recently noted:
“The armchair professional Fed economists with job security may believe that a burst of economically-destructive inflation is imminent, but those people who bet actual money on it do not.”
The problem for the Fed is that, as shown below, by the break even inflation rates as compared to CPI…there is no threat of inflation.
[image]https://realinvestmentadvice.com/wp-content/uploads/2015/12/Inflation-5-10yr-Breakevenrates-121415.png[/image]
Corporate Profit Margins
Over the past six years, one of the “bull” arguments for the stock market has been surging corporate profitability. Historically, as shown in the chart below, when the Fed has increased interest rates coincident with a decline in corporate profitability, a recession has not been too long to follow.
[image]https://realinvestmentadvice.com/wp-content/uploads/2015/12/Profit-Margins-Fed-Funds-121415.png[/image]
This makes sense as higher interest rates are used to slow the pace of economic growth by increasing borrowing costs. In turn, slower economic growth quells inflationary pressures. The problem, as I noted above, is with inflation currently running well below the Fed’s target levels and economic growth weak best, there is very little room for policy error at this juncture.
Fed’s LMCI Not Confirming Rate Hike
While the inherently “bullish” mainstream media, and Wall Street analysts, cheered the recent uptick in employment (despite being primarily comprised of individuals working multiple part-time jobs) as clear evidence for the Fed to act, the Fed’s own Labor Market Conditions Index is not confirming the same.
[image]https://realinvestmentadvice.com/wp-content/uploads/2015/12/LMCI-Employment-121415.png[/image]
While many suggest that a quarter point rate hike is “no big deal,” which is likely true in the very short-term, it has always been the “start of countdown” to the next recession.
What is crucial to notice is that historically when the Fed has engaged in hiking interest rates, it has been coincident with a peak in employment trends. Again, as stated above, this makes complete sense as higher interest rates are used to quell both economic growth and inflationary pressures. More importantly, the recent down-tick in the LMCI index is much less optimistic than employment headlines suggest which makes one question why the Federal Reserve is so focused on the unemployment rate.
The Countdown To The Next Recession Begins
As I penned last week:
“As shown, the markets tend to decline by 30% on average historically but, as witnessed since the turn of this century, some recessionary declines can be far worse. The resulting destruction of investor capital leaves many unable to reach their financial goals longer term as they repeatedly spend years trying to “get back to even.”
While much of the financial media and Wall Street analysts continue to ignore the risks of a recession, there are some important warning signs that suggest this might be a bad idea.”
There are many economic indicators such as inventory ratios, manufacturing, production, imports, and commodity prices which are all suggesting much weaker economic underpinnings. However, such warning signs are being dismissed in hopes that “this time is different” and “services” can keep the U.S. an island of prosperity in the midst of a global recessionary storm.
This belief has a vast majority of the mainstream media pointing to historical averages as evidence the economy has several years of growth following the first rate hike. The problem is the word “average.”
When looking at historical time frames, one must not look at averages of all rate hikes but rather what happened when a rate hiking campaign began from similar economic growth levels. Looking back in history we can only identify TWO previous times when the Fed began tightening monetary policy when economic growth rates were at 2% or less.
(There is a vast difference in timing for the economy to slide into recession from 6%, 4%, and 2% annual growth rates.)
[image]https://realinvestmentadvice.com/wp-content/uploads/2015/12/Fed-Rates-Vs-GDP-121415.png[/image]
With economic growth currently running at THE LOWEST average growth rate in American history, the time frame between the first rate and next recession will not be long.
However, as I have stated many times in the past, it is quite likely the Fed is already well aware that we are very late in the current economic cycle. For them, the worst of all possible outcomes is being caught at the “zero bound” of interest rates when the next recession begins which removes one of the more effective policy tools at their disposal.
For investors, there is little “reward” in the current environment for taking on excess exposure to risk assets. The deteriorating junk bond market, declining profitability and weak economic underpinnings suggest that the clock has already begun ticking. The only question is how much time is left.