![]()
See more visualizations like this on the Voronoi app.
Use This Visualization
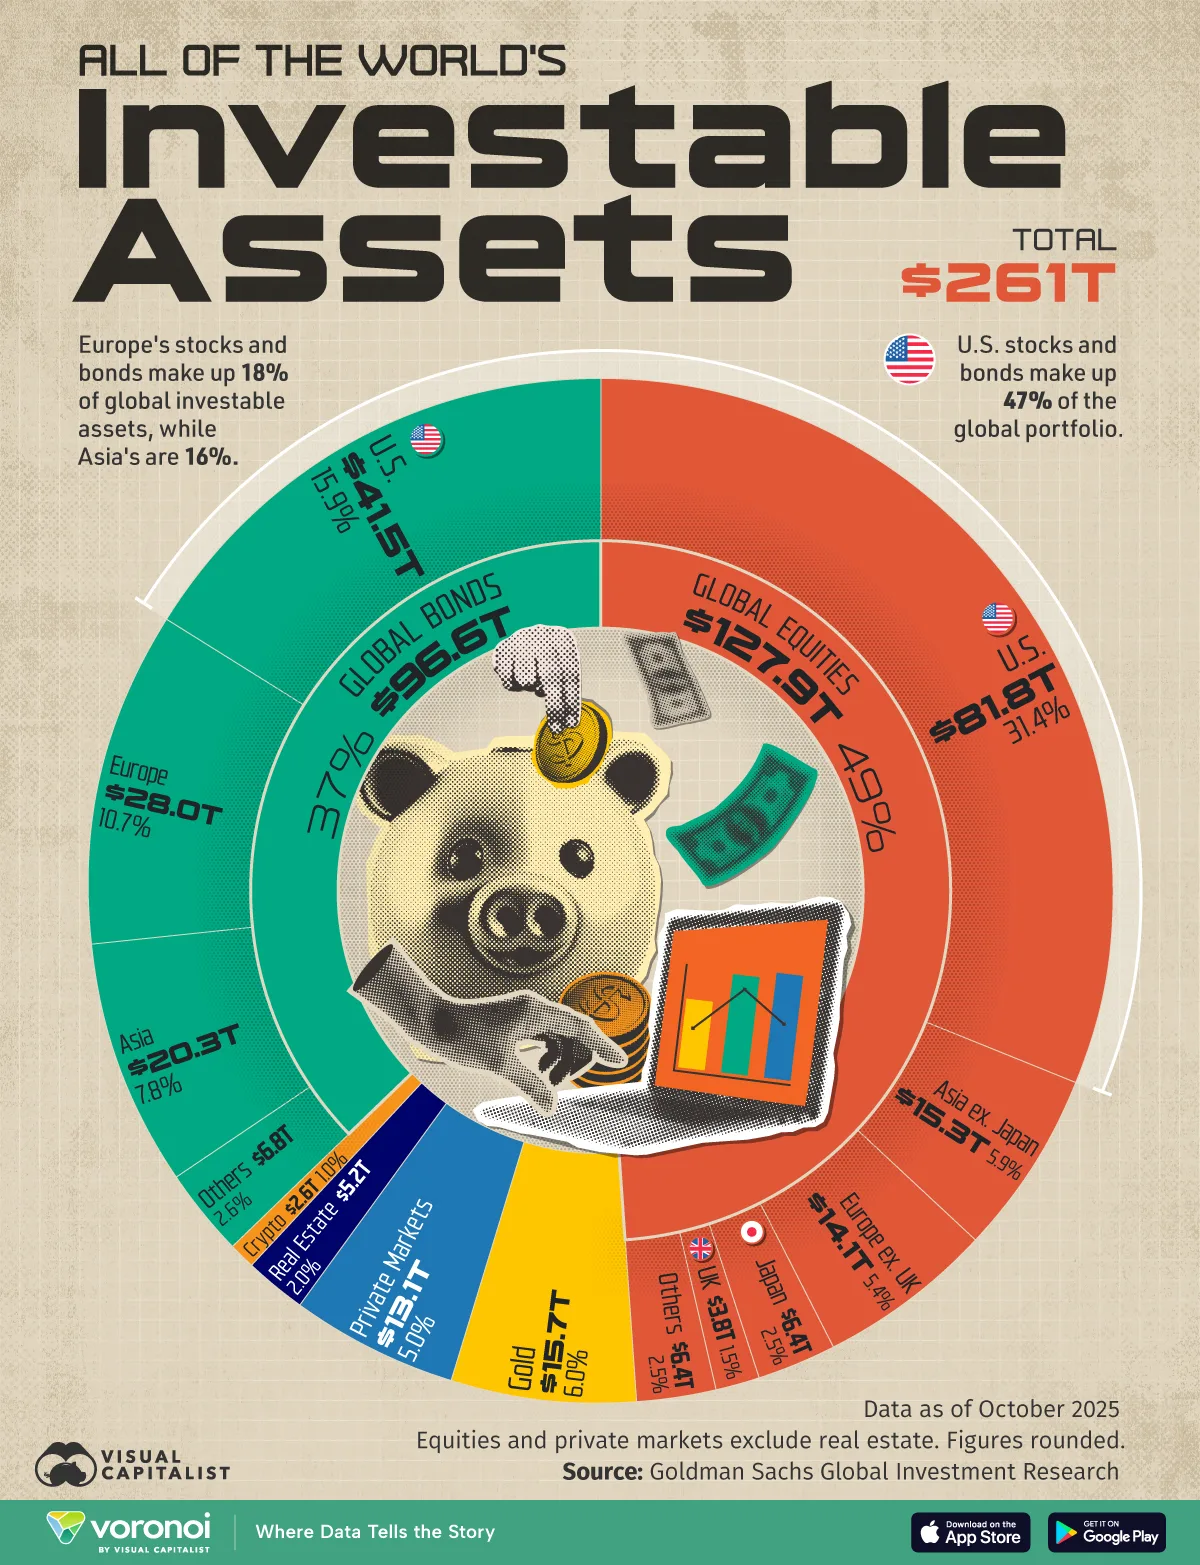
Visualizing $261 Trillion in Global Investment Assets
See visuals like this from many other data creators on our Voronoi app. Download it for free on iOS or Android and discover incredible data-driven charts from a variety of trusted sources.
Key Takeaways
- The U.S. makes up 64% of global stock market capitalization, a share sitting at historically elevated levels.
- European equities and bonds make up 18% of the global investable asset universe.
America commands a significant share of global investment assets, with U.S. equities and bonds accounting for 47% of the world portfolio.
This dominance is driven in part by the S&P 500’s strong long-term performance and the outsized influence of major U.S. tech firms. At the same time, the dollar’s status as the world’s reserve currency underpins demand for U.S. fixed income.
This graphic shows the global portfolio of investable assets, based on data from Goldman Sachs Investment Research.
The Global Portfolio of Investment Assets in 2025
Below, we show the value of each asset category in 2025:
| Asset Class | 2025 Value |
|---|---|
| U.S. equities | $81.8T |
| Asia equities (ex Japan) | $15.3T |
| Europe equities (ex UK) | $14.1T |
| Japan equities | $6.4T |
| UK equities | $3.8T |
| Other equities | $6.4T |
| U.S. bonds | $41.5T |
| Europe bonds | $28.0T |
| Asia bonds (ex Japan) | $20.3T |
| Other bonds | $6.8T |
| Gold | $15.7T |
| Private markets | $13.1T |
| Real estate | $5.2T |
| Crypto | $2.6T |
| Total | $261T |
Global equities total $127.9 trillion, and the U.S. alone accounts for 64% of global stock market capitalization.
In recent years, AI-driven optimism has pushed U.S. stocks higher, lifting America’s share to its highest level in decades. By comparison, the U.S. represented only about 40% of global equities following the global financial crisis.
Meanwhile, Asia ex-Japan ranks a distant second, representing 12% of global investable assets. Yet within the region, performance has diverged sharply. India’s main stock exchange has generated 16% annualized returns over the past five years, while China’s Shanghai Stock Exchange has returned just 2.8% over the same period.
Turning to fixed income, global bond markets stand at $96.6 trillion. Here again, the U.S. leads with a 43% share, while Europe follows with 29%.
Beyond stocks and bonds, gold stands at $15.7 trillion in value, accounting for 6% of the global portfolio. Cryptocurrencies, meanwhile, remain a small slice of the total, making up 1% of global assets with a market capitalization of $2.6 trillion.
Learn More on the Voronoi App ![]()
To learn more about this topic, check out this graphic on the world’s biggest stock exchanges.