![]()
See this visualization first on the Voronoi app.
Use This Visualization
Breaking Down the Price of a New Home in the U.S.
This was originally posted on our Voronoi app. Download the app for free on iOS or Android and discover incredible data-driven charts from a variety of trusted sources.
Buying a new home is one of the biggest investments most Americans will make—but what exactly goes into the selling price of a new home?
This visual breaks down the average sales price of a new single-family home in the United States in 2024, based on data from the National Association of Home Builders (NAHB), which surveyed 4,000 U.S. home builders to obtain the data.
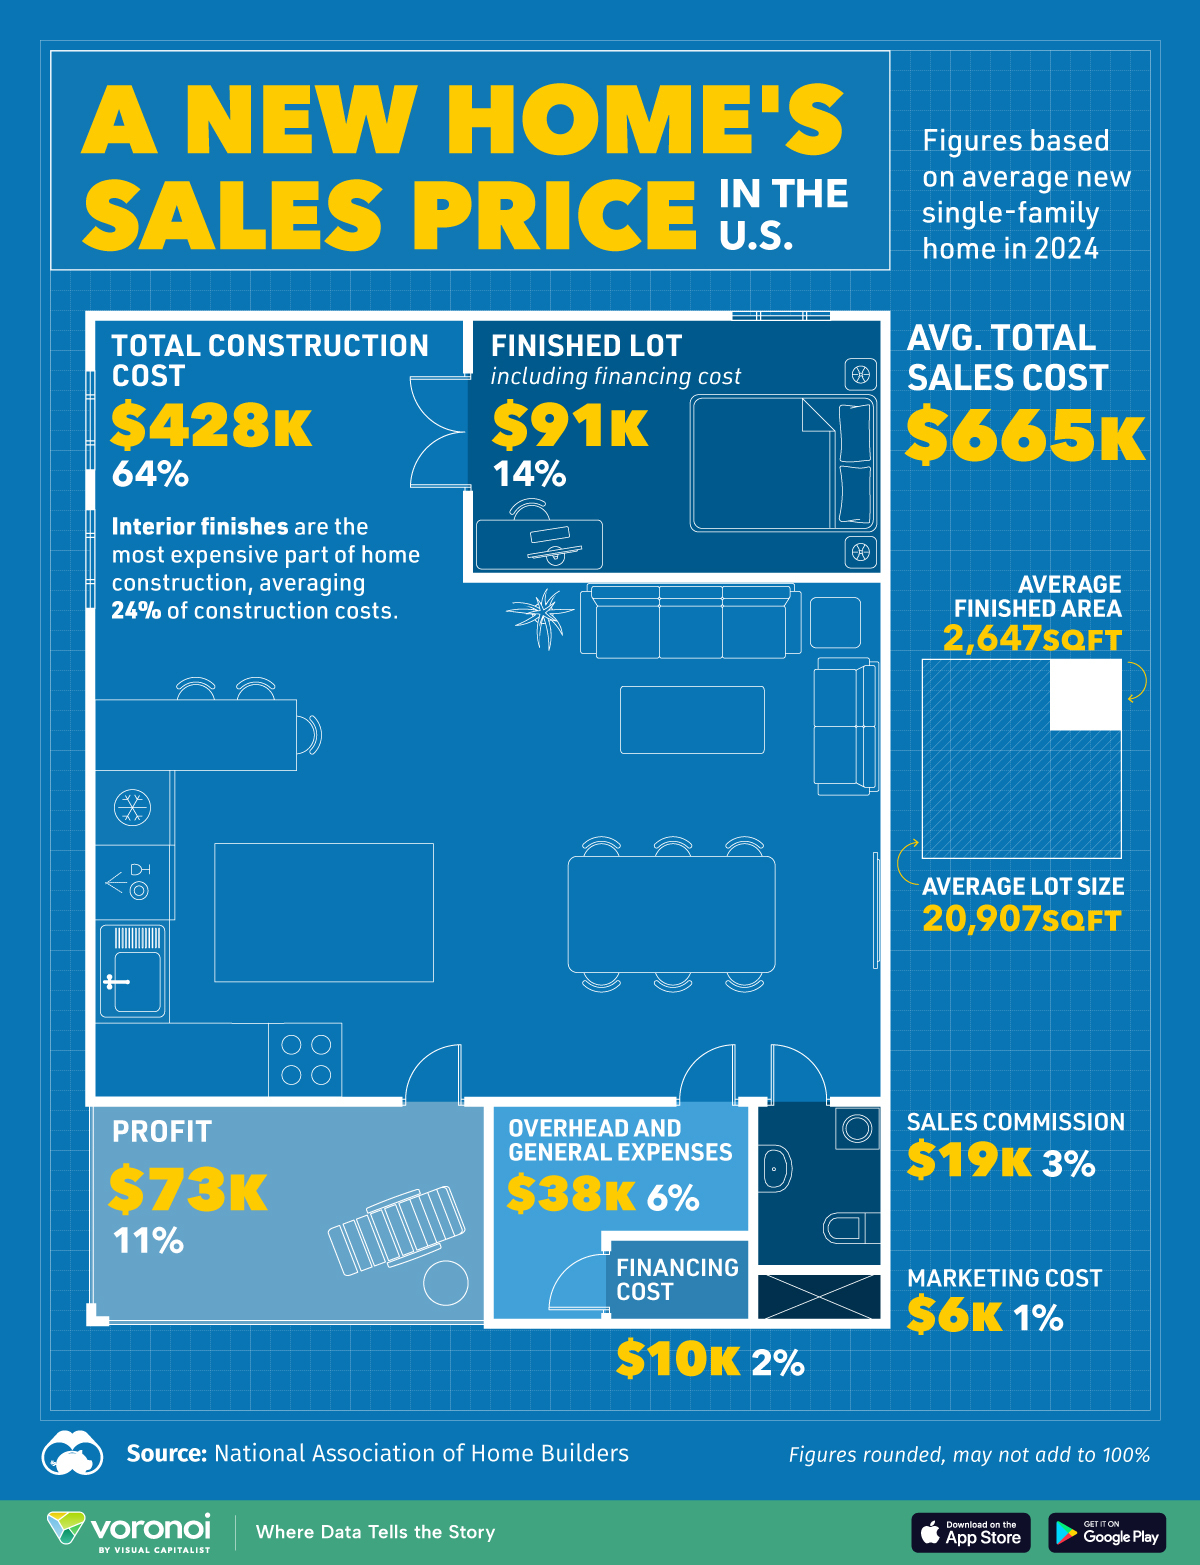
What Makes Up the Price of a New Home?
According to NAHB, the price of an average single-family home was $665,298 in 2024, up nearly 67% from a decade ago ($399,532 in 2013).
Here’s a breakdown of the average total price of a new home, by cost components:
| Category | Average Cost | Share of Sales Price |
|---|---|---|
| Total Construction Cost | $428,215 | 64.4% |
| Finished Lot (including financing cost) | $91,057 | 13.7% |
| Financing Cost | $10,220 | 1.5% |
| Overhead and General Expenses | $38,248 | 5.7% |
| Marketing Cost | $5,633 | 0.8% |
| Sales Commission | $18,955 | 2.8% |
| Profit | $72,971 | 11.0% |
| Total Sales Price | $665,298 | 100% |
Construction is by far the biggest cost, accounting for nearly two-thirds of the total sales price. According to NAHB, interior finishes are the most expensive to build, making up about 24% of total construction costs. Lumber prices also play a major role in these construction costs, as over 90% of all new U.S. homes are wood-framed.
Meanwhile, the cost of the lot—land and any related financing—makes up just under 14% of the total. Builders’ profit margins average around 11%, or nearly $73,000 per home.
Lot Size vs. Finished Home Area Compared
The average lot size for a single-family home was upwards of 20,000 square feet in 2024. However, the finished home area (floor space) was just 2,647 square feet. This means just over 13% of the lot’s area is occupied by the finished home.
According to NAHB, the smaller square footage of homes is partly down to builders trying to limit construction costs and keep homes affordable. The rest of the land is typically used for yards, landscaping, open spaces, and to meet zoning laws.
The State of the U.S. Housing Market
New homebuyers in the United States are likely to face a challenging year in 2025.
U.S. home prices have steadily increased over the last year. However, both existing home sales and housing inventory levels remain relatively low, underlining a tight demand-supply situation.
Additionally, fixed mortgage rates remain around their highest levels in over two decades, making monthly payments less affordable for new buyers.
Due to these factors, the U.S. housing market is likely to remain relatively subdued in 2025. Real estate firm Zillow predicts that U.S. home prices will rise by a marginal 0.8% over the 12 months ending February 2026.
Learn More on the Voronoi App ![]()
If you enjoyed this infographic, check out The Growth in Home Prices by Country.
The post Breaking Down the Price of a New Home in the U.S. appeared first on Visual Capitalist.