![]()
See more visuals like this on the Voronoi app.
Use This Visualization
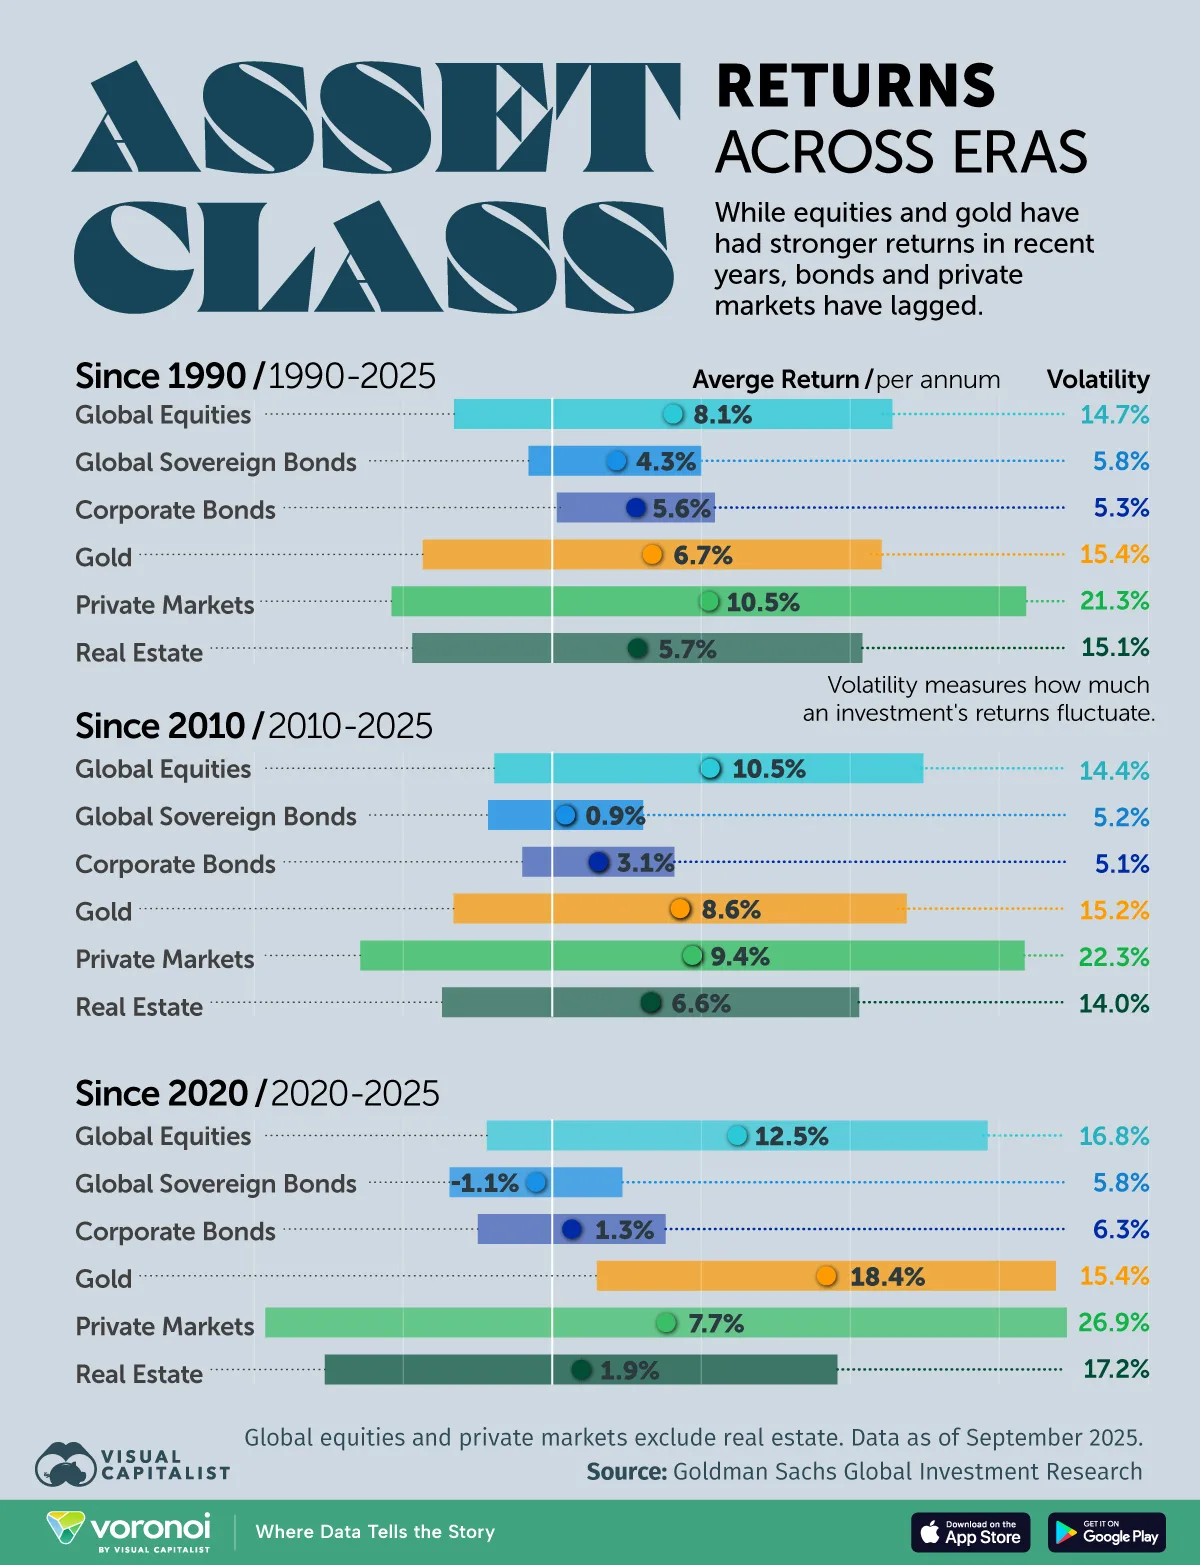
Charted: Asset Class Returns Across Eras (1990–2025)
See visuals like this from many other data creators on our Voronoi app. Download it for free on iOS or Android and discover incredible data-driven charts from a variety of trusted sources.
Key Takeaways
- Private markets delivered the strongest long-term returns since 1990, but with the highest volatility.
- Since 2020, gold has been the best-performing asset with an 18.4% annualized return.
- Bonds have struggled in recent years as higher interest rates and inflation weigh on fixed-income returns.
Investment performance can vary widely depending on the time period analyzed. While equities and gold have delivered strong returns in recent years, bonds and some alternative assets have lagged, especially in the post-pandemic era of rising interest rates.
This graphic breaks down annualized returns and volatility across major asset classes over three distinct periods: long-term (1990–2025), mid-term (2010–2025), and the most recent cycle (2020–2025), using data from Goldman Sachs. Global equities and private markets exclude real estate, and data is as of September 2025.
Understanding volatility: Volatility measures how much an investment’s returns fluctuate year to year. For example, a volatility of 10% implies that returns typically move about 10 percentage points above or below the average in a given year. While higher volatility often accompanies higher returns, it also increases the risk of short-term losses.
Long-Term Returns by Asset Class: 1990–2025
Over the past 35 years, risk assets have significantly outperformed safer alternatives.
| Asset Class | 1990–2025 Return (per annum) | Volatility |
|---|---|---|
| Global equities | 8.1% | 14.7% |
| Global sovereign bonds | 4.3% | 5.8% |
| Corporate bonds | 5.6% | 5.3% |
| Gold | 6.7% | 15.4% |
| Private markets | 10.5% | 21.3% |
| Real estate | 5.7% | 15.1% |
Private markets delivered the strongest annualized returns at 10.5%, although this came with substantial volatility of over 21%. Global equities also performed well, averaging just over 8% annually.
Bonds offered more modest but stable returns, while gold provided diversification benefits with mid-range returns and high volatility.
Post-Global Financial Crisis Asset Performance: 2010–2025
The period following the Global Financial Crisis was marked by low interest rates and strong equity performance.
| Asset Class | 2010–2025 Return (per annum) | Volatility |
|---|---|---|
| Global equities | 10.5% | 14.4% |
| Global sovereign bonds | 0.9% | 5.2% |
| Corporate bonds | 3.1% | 5.1% |
| Gold | 8.6% | 15.2% |
| Private markets | 9.4% | 22.3% |
| Real estate | 6.6% | 14.0% |
Global equities saw annualized returns rise to 10.5%, while private markets continued to outperform public assets.
In contrast, sovereign bonds struggled as yields compressed, delivering less than 1% annual returns. Gold remained resilient during this era, with prices rising sharply from 2009 to 2012, before falling and stabilizing.
Post-Pandemic Asset Class Returns: 2020–2025
The most recent five-year period highlights a sharp divergence across asset classes.
| Asset Class | 2020–2025 Return (per annum) | Volatility |
|---|---|---|
| Global equities | 12.5% | 16.8% |
| Global sovereign bonds | -1.1% | 5.8% |
| Corporate bonds | 1.3% | 6.3% |
| Gold | 18.4% | 15.4% |
| Private markets | 7.7% | 26.9% |
| Real estate | 1.9% | 17.2% |
Global equities delivered strong returns following the 2020 crash, despite market volatility.
Meanwhile, gold has been the best-performing asset amid rising inflation, geopolitical risks, and elevated interest rates, with prices hitting all-time highs twice since 2020.
Bonds experienced negative real and nominal performance as rapid interest rate hikes eroded prices. Rising inflation and high sovereign debt levels have put downward pressure on sovereign bond prices.
Furthermore, real estate has seen relatively low returns relative to medium- and long-term periods, with high mortgage rates dampening the demand for housing in many major markets.
Learn More on the Voronoi App ![]()
If you found this infographic interesting, explore more investing and market insights on Voronoi, including The Ups and Downs of Global Markets in 2025