![]()
See more visualizations like this on the Voronoi app.
Use This Visualization
How Income Distribution Stacks Up in America
See visuals like this from many other data creators on our Voronoi app. Download it for free on iOS or Android and discover incredible data-driven charts from a variety of trusted sources.
Key Takeaways
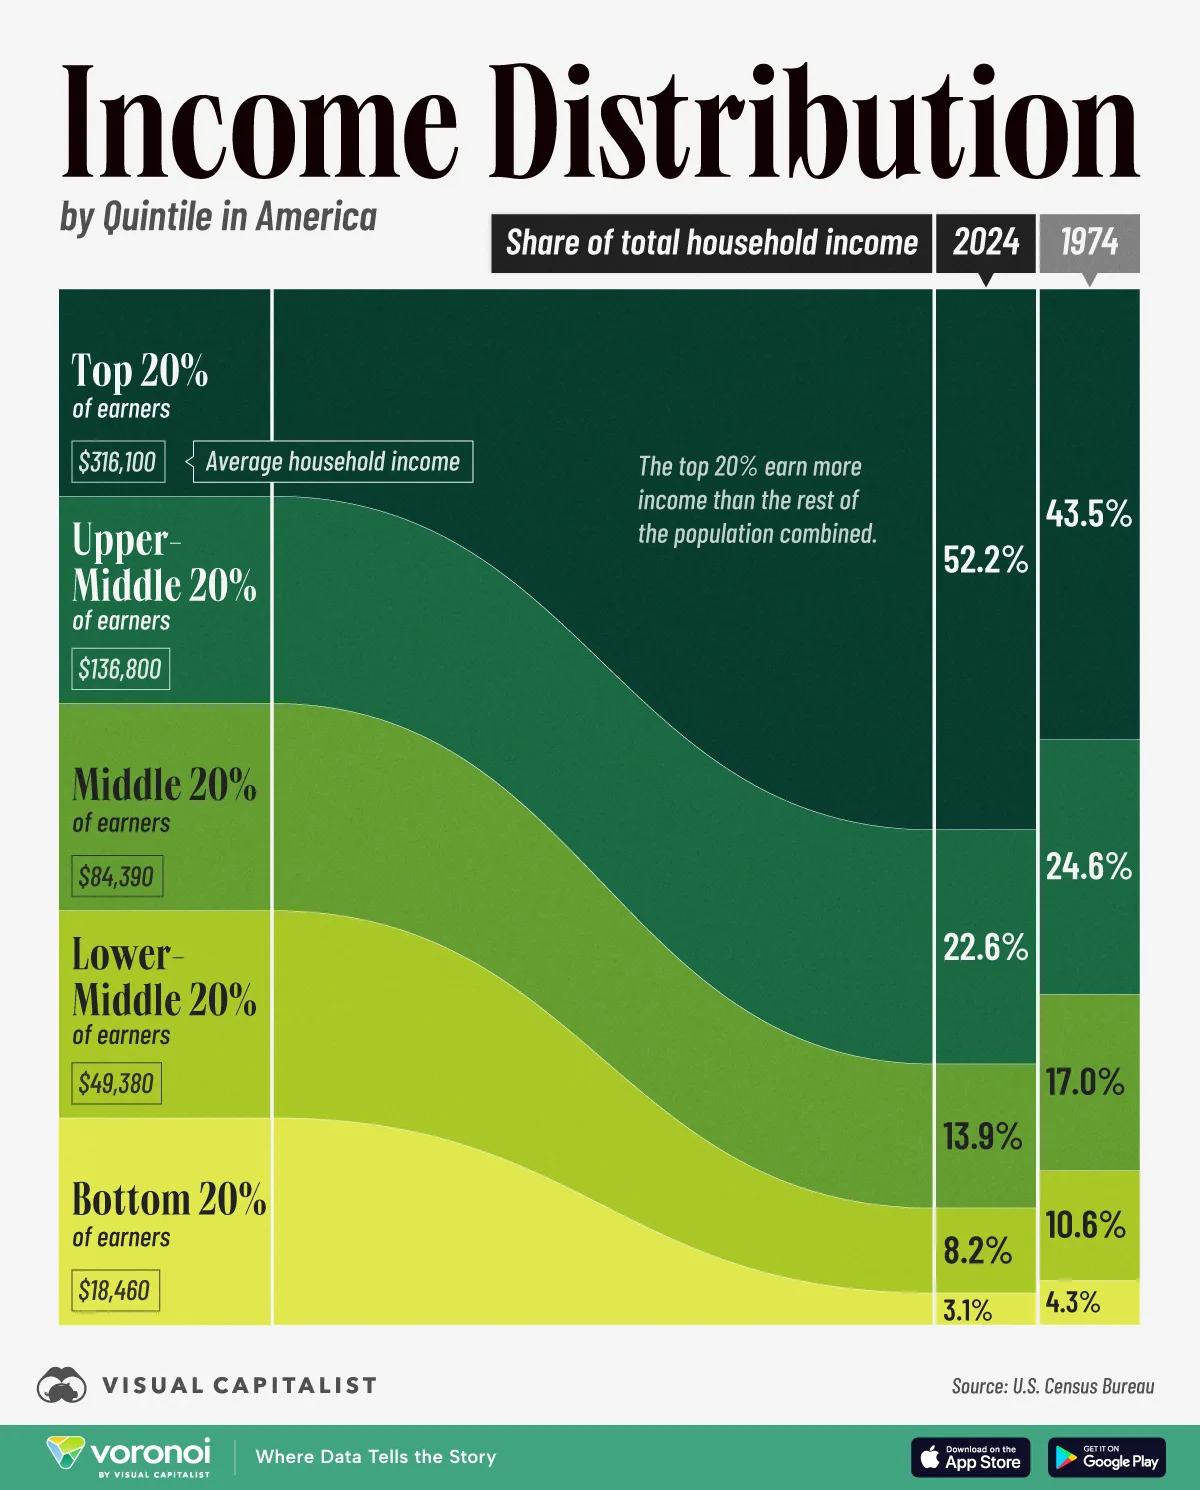
- The top 20% of U.S. earners receive more than half of all national income, a figure that has climbed from 43.5% in 1974.
- The middle 20% of earners, averaging $84,390 in household income, received 13.9% of the total.
High income households in America capture a large share of the nation’s earnings, and this gulf has widened over time.
In 2024, the top 20%—with an average household income of $316,100—took home 52.2% of all national income, up 8.7 percentage points from 1974. Meanwhile, the bottom 20% received just 3.1%, further shrinking over the period.
This graphic shows U.S. household income distribution in 2024, based on data from the U.S. Census Bureau.
Trends in U.S. Income Distribution (2024 vs. 1974)
Below, we show how household income is divided across different income brackets:
| Income Level | Average Household Income (2024) | Share of Household Income 2024 | Share of Household Income 1974 | Change in Share1974-2024 (p.p.) |
|---|---|---|---|---|
| Bottom 20% | $18,460 | 3.1% | 4.3% | -1.2 |
| Second 20% | $49,380 | 8.2% | 10.6% | -2.4 |
| Middle 20% | $84,390 | 13.9% | 17.0% | -3.1 |
| Fourth 20% | $136,800 | 22.6% | 24.6% | -2.0 |
| Top 20% | $316,100 | 52.2% | 43.5% | +8.7 |
| Top 5% | $560,000 | 23.1% | 16.5% | +6.6 |
In 2024, the bottom fifth of U.S. earners averaged $18,460 in household income. While small, their share of total national income has fallen sharply, declining by about 28% since 1974.
Moreover, this group includes workers earning the federal minimum wage of $7.25 per hour, as well as the roughly 760,000 workers who earn below this level. In particular, younger workers make up a large portion of this bracket, with 43% of those earning minimum wage or less being 25 years old or younger.
As we can see, the middle fifth of earners received 13.9% of U.S. household income in 2024, down from 17% in 1974. With an average household income of $84,390, this bracket largely reflects median-wage workers, spanning occupations such as civil engineers, computer programmers, and clinical psychologists.
On the other hand, the top 5% of earners, averaging $560,000 in income has seen it share expand by 6.6 percentage points. Moreover, it is the only income bracket, along with the top 20%, to see its share of national income grow compared to 1974.
Learn More on the Voronoi App ![]()
To learn more about this topic, check out this graphic on real wage growth by state.