![]()
See this visualization first on the Voronoi app.
Use This Visualization
Visualized: How Much Time Americans Have Left to Live, by Age
This was originally posted on our Voronoi app. Download the app for free on iOS or Android and discover incredible data-driven charts from a variety of trusted sources.
Key Takeaways
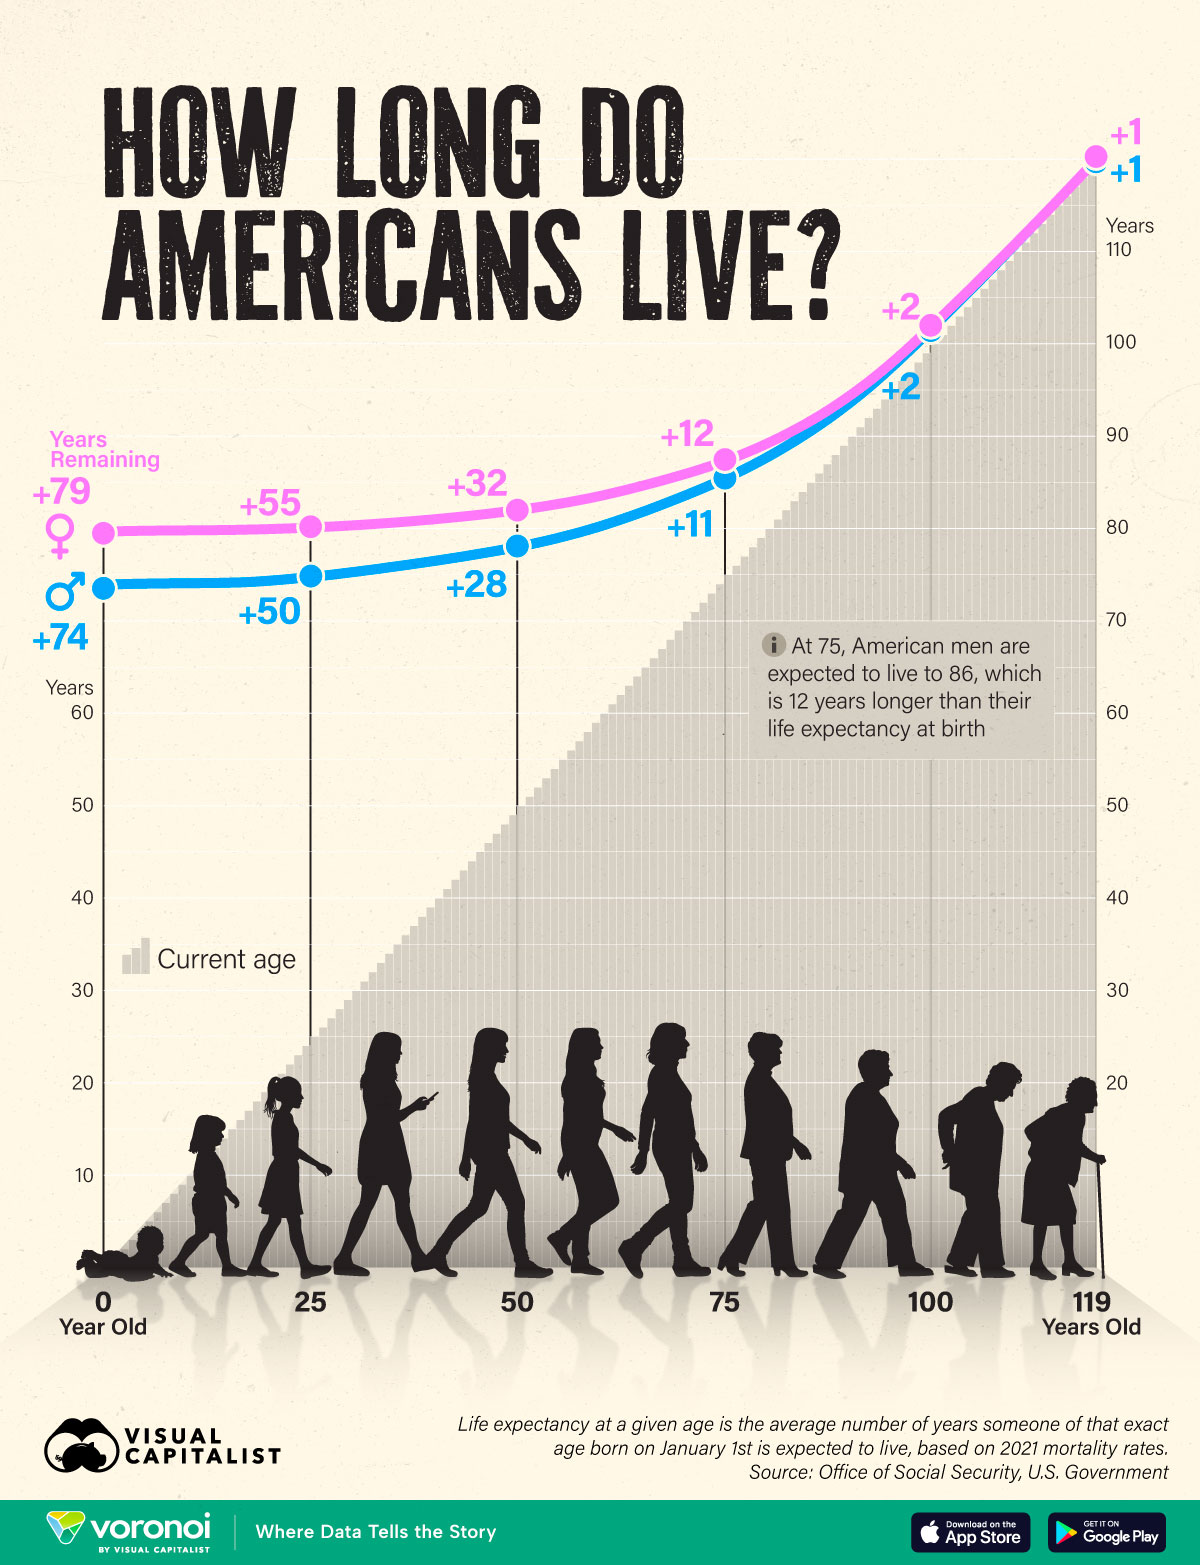
- U.S. life expectancy at birth for men is about 74, versus 79 for women.
- However as Americans age, their potential lifespan increases as well.
- At 75, an American man can expect to live to 86, which is 12 years longer than the life expectancy at birth.
Life expectancy is a tricky thing, often misunderstood as a prediction for individuals instead of a statistical average for a group of people.
It is calculated using life tables, which track the death rates of a population across different age groups.
Statisticians start with a hypothetical group (often 100,000 people) and apply the observed mortality at each age to see how many of that group would be expected to survive year by year.
Thus, the average age at death for that group becomes their life expectancy at birth. There are also life expectancy figures calculated for other ages, which take into account the fact that someone has already survived to that age.
This chart uses 2024 data from the Office of Social Security (which uses 2021 mortality rates) to illustrate the latter phenomenon, showing how American life expectancy changes as Americans get older.
U.S. Life Expectancy at Every Age
U.S. life expectancy at birth for men is about 74, versus 79 for women.
| Exact age | U.S. Men Life Expectancy |
American Men Potential Lifespan |
U.S. Women Life Expectancy |
American Women Potential Lifespan |
|---|---|---|---|---|
| 0 | 74 | 74 | 79 | 79 |
| 1 | 73 | 74 | 79 | 80 |
| 2 | 72 | 74 | 78 | 80 |
| 3 | 71 | 74 | 77 | 80 |
| 4 | 70 | 74 | 76 | 80 |
| 5 | 69 | 74 | 75 | 80 |
| 6 | 68 | 74 | 74 | 80 |
| 7 | 67 | 74 | 73 | 80 |
| 8 | 66 | 74 | 72 | 80 |
| 9 | 65 | 74 | 71 | 80 |
| 10 | 64 | 74 | 70 | 80 |
| 11 | 63 | 74 | 69 | 80 |
| 12 | 62 | 74 | 68 | 80 |
| 13 | 61 | 74 | 67 | 80 |
| 14 | 60 | 74 | 66 | 80 |
| 15 | 59 | 74 | 65 | 80 |
| 16 | 58 | 74 | 64 | 80 |
| 17 | 57 | 74 | 63 | 80 |
| 18 | 56 | 74 | 62 | 80 |
| 19 | 55 | 74 | 61 | 80 |
| 20 | 54 | 74 | 60 | 80 |
| 21 | 53 | 74 | 59 | 80 |
| 22 | 53 | 75 | 58 | 80 |
| 23 | 52 | 75 | 57 | 80 |
| 24 | 51 | 75 | 56 | 80 |
| 25 | 50 | 75 | 55 | 80 |
| 26 | 49 | 75 | 54 | 80 |
| 27 | 48 | 75 | 53 | 80 |
| 28 | 47 | 75 | 52 | 80 |
| 29 | 46 | 75 | 51 | 80 |
| 30 | 45 | 75 | 50 | 80 |
| 31 | 44 | 75 | 49 | 80 |
| 32 | 44 | 76 | 49 | 81 |
| 33 | 43 | 76 | 48 | 81 |
| 34 | 42 | 76 | 47 | 81 |
| 35 | 41 | 76 | 46 | 81 |
| 36 | 40 | 76 | 45 | 81 |
| 37 | 39 | 76 | 44 | 81 |
| 38 | 38 | 76 | 43 | 81 |
| 39 | 37 | 76 | 42 | 81 |
| 40 | 37 | 77 | 41 | 81 |
| 41 | 36 | 77 | 40 | 81 |
| 42 | 35 | 77 | 39 | 81 |
| 43 | 34 | 77 | 38 | 81 |
| 44 | 33 | 77 | 37 | 81 |
| 45 | 32 | 77 | 37 | 82 |
| 46 | 31 | 77 | 36 | 82 |
| 47 | 31 | 78 | 35 | 82 |
| 48 | 30 | 78 | 34 | 82 |
| 49 | 29 | 78 | 33 | 82 |
| 50 | 28 | 78 | 32 | 82 |
| 51 | 27 | 78 | 31 | 82 |
| 52 | 27 | 79 | 30 | 82 |
| 53 | 26 | 79 | 29 | 82 |
| 54 | 25 | 79 | 29 | 83 |
| 55 | 24 | 79 | 28 | 83 |
| 56 | 23 | 79 | 27 | 83 |
| 57 | 23 | 80 | 26 | 83 |
| 58 | 22 | 80 | 25 | 83 |
| 59 | 21 | 80 | 24 | 83 |
| 60 | 20 | 80 | 24 | 84 |
| 61 | 20 | 81 | 23 | 84 |
| 62 | 19 | 81 | 22 | 84 |
| 63 | 18 | 81 | 21 | 84 |
| 64 | 18 | 82 | 21 | 85 |
| 65 | 17 | 82 | 20 | 85 |
| 66 | 16 | 82 | 19 | 85 |
| 67 | 16 | 83 | 18 | 85 |
| 68 | 15 | 83 | 17 | 85 |
| 69 | 14 | 83 | 17 | 86 |
| 70 | 14 | 84 | 16 | 86 |
| 71 | 13 | 84 | 15 | 86 |
| 72 | 12 | 84 | 15 | 87 |
| 73 | 12 | 85 | 14 | 87 |
| 74 | 11 | 85 | 13 | 87 |
| 75 | 11 | 86 | 12 | 87 |
| 76 | 10 | 86 | 12 | 88 |
| 77 | 9 | 86 | 11 | 88 |
| 78 | 9 | 87 | 11 | 89 |
| 79 | 8 | 87 | 10 | 89 |
| 80 | 8 | 88 | 9 | 89 |
| 81 | 7 | 88 | 9 | 90 |
| 82 | 7 | 89 | 8 | 90 |
| 83 | 7 | 90 | 8 | 91 |
| 84 | 6 | 90 | 7 | 91 |
| 85 | 6 | 91 | 7 | 92 |
| 86 | 5 | 91 | 6 | 92 |
| 87 | 5 | 92 | 6 | 93 |
| 88 | 5 | 93 | 5 | 93 |
| 89 | 4 | 93 | 5 | 94 |
| 90 | 4 | 94 | 5 | 95 |
| 91 | 4 | 95 | 4 | 95 |
| 92 | 3 | 95 | 4 | 96 |
| 93 | 3 | 96 | 4 | 97 |
| 94 | 3 | 97 | 3 | 97 |
| 95 | 3 | 98 | 3 | 98 |
| 96 | 3 | 99 | 3 | 99 |
| 97 | 2 | 99 | 3 | 100 |
| 98 | 2 | 100 | 3 | 101 |
| 99 | 2 | 101 | 3 | 102 |
| 100 | 2 | 102 | 2 | 102 |
| 101 | 2 | 103 | 2 | 103 |
| 102 | 2 | 104 | 2 | 104 |
| 103 | 2 | 105 | 2 | 105 |
| 104 | 2 | 106 | 2 | 106 |
| 105 | 2 | 107 | 2 | 107 |
| 106 | 1 | 107 | 2 | 108 |
| 107 | 1 | 108 | 1 | 108 |
| 108 | 1 | 109 | 1 | 109 |
| 109 | 1 | 110 | 1 | 110 |
| 110 | 1 | 111 | 1 | 111 |
| 111 | 1 | 112 | 1 | 112 |
| 112 | 1 | 113 | 1 | 113 |
| 113 | 1 | 114 | 1 | 114 |
| 114 | 1 | 115 | 1 | 115 |
| 115 | 1 | 116 | 1 | 116 |
| 116 | 1 | 117 | 1 | 117 |
| 117 | 1 | 118 | 1 | 118 |
| 118 | 1 | 119 | 1 | 119 |
| 119 | 1 | 120 | 1 | 120 |
Note: Figures rounded from source numbers.
However, the older you get, the more your potential lifespan increases.
For example, at 75, an American man can expect to live to 86, which is 12 years longer than the original life expectancy at birth (74 years).
Why does life expectancy improve as you get older?
We made the same graphic in a slightly different way in case it helps improve clarity.
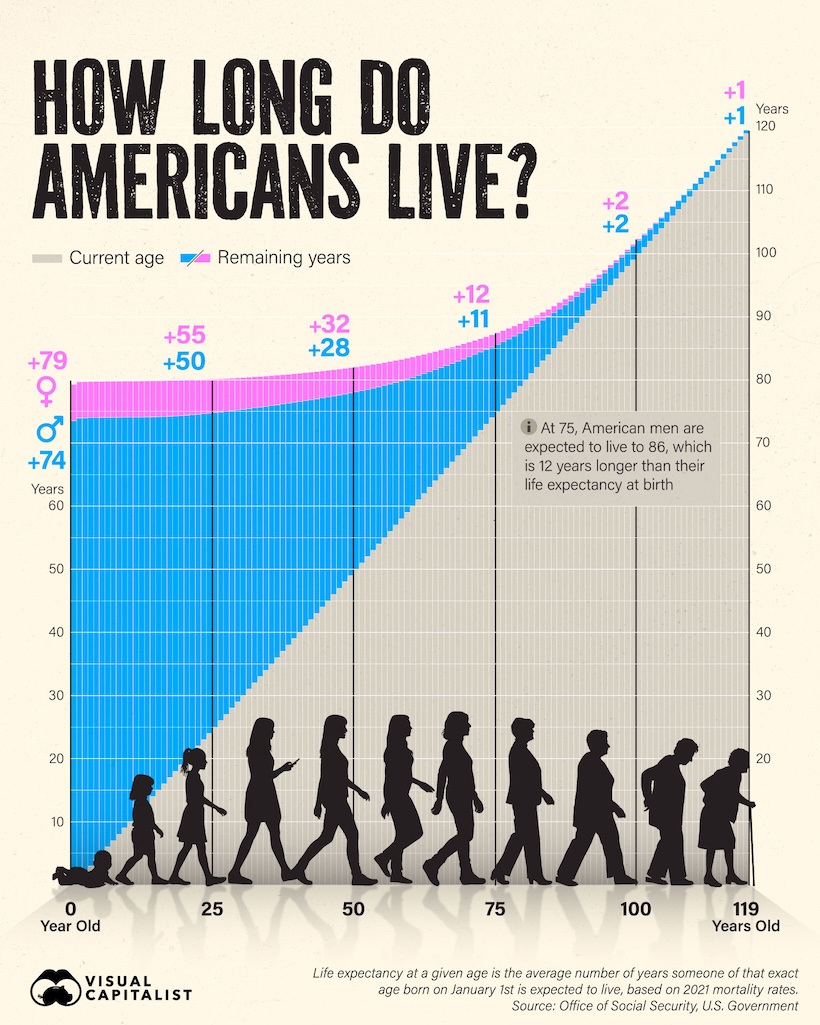
Note: See this visualization first on the Voronoi app.
It’s because most older American adults have already dodged the biggest risks to life: infant mortality, violence, and car crashes.
There is also survivor bias at play.
The lifestyle habits that have allowed them to live so long will only contribute to them living longer.
However, any big environmental change that affects mortality rates in a country (wars, famines, or pandemics) can have a huge impact on life expectancies.
For example, the life expectancy for American men at birth in 2019 was 76, two years longer than their current life expectancies at birth. This is a reflection of pandemic-related deaths in 2021 that increased mortality rates for the population.
Learn More on the Voronoi App ![]()
How do Americans compare to the rest of the world on this metric? Check out, Mapped: Life Expectancy by Country in 2025 for a quick overview. Note: this map uses 2025 projections, which is a different data source from what this article uses.