![]()
See this visualization first on the Voronoi app.
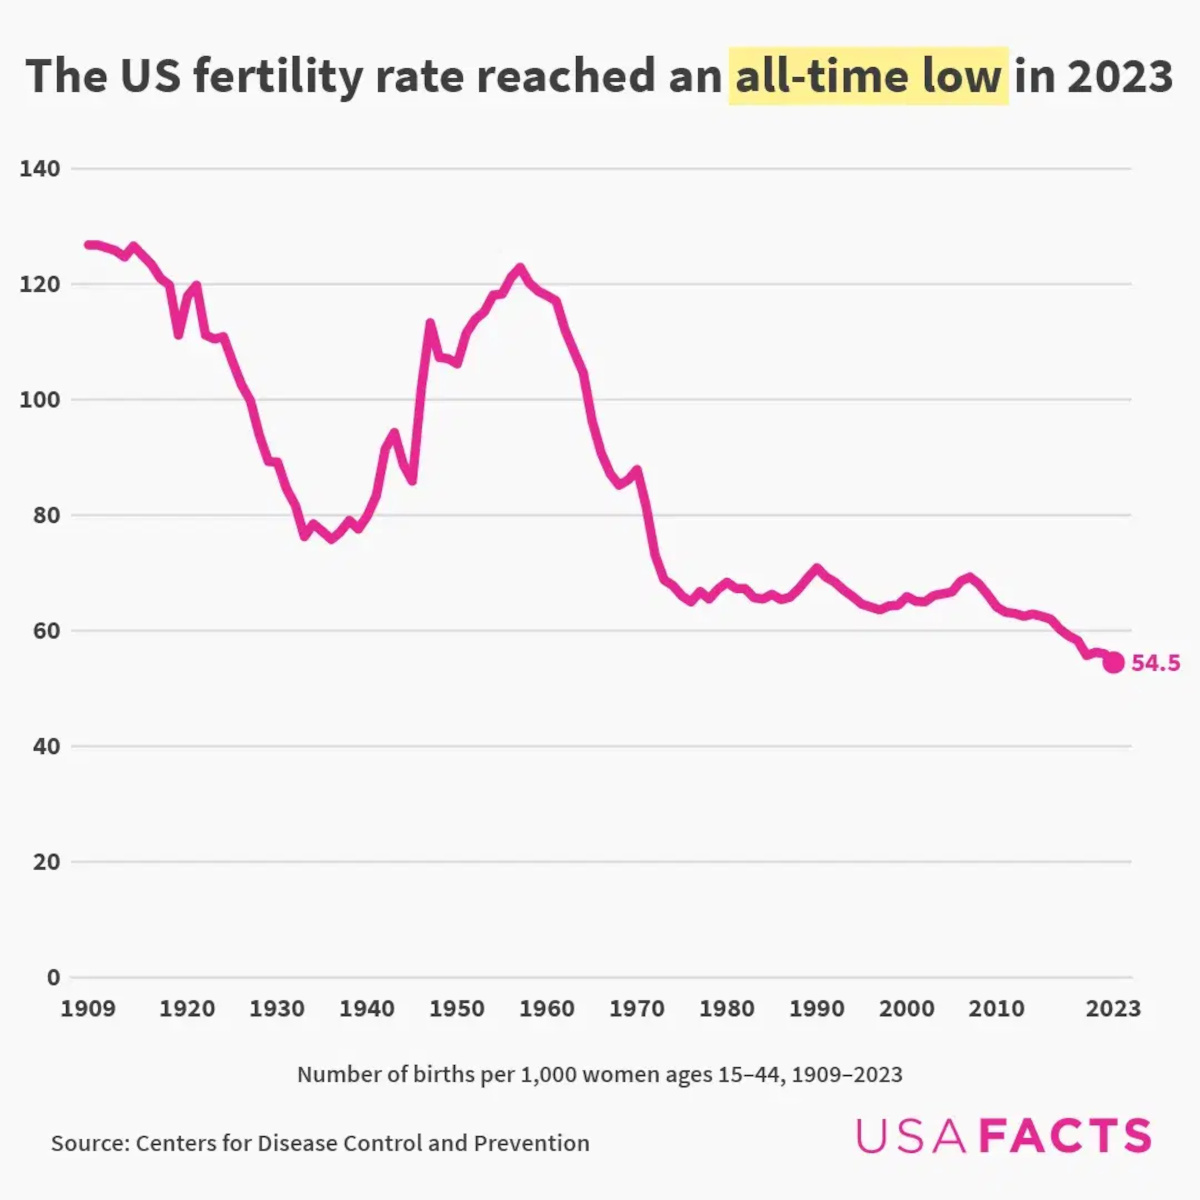
Charted: The U.S. Fertility Rate is at All-Time Lows (1909-2023)
This was originally posted on our Voronoi app. Download the app for free on iOS or Android and discover incredible data-driven charts from a variety of trusted sources.
- The U.S. fertility rate in 2023 was just 54.5 births per 1,000 women, a historic low.
- Since peaking in 1957 at 122.9 births per 1,000 women, the rate has been in steady decline.
- More women are having children later in life, with women aged 30–34 now showing the highest birth rates.
For over a century, the fertility rate in the United States has reflected sweeping demographic and societal changes. This dataset, visualized by USAFacts using data from the CDC, captures the trend from 1909 through 2023.
| Year | Births per 1,000 women (aged 15-44) |
|---|---|
| 1909 | 126.8 |
| 1910 | 126.8 |
| 1911 | 126.3 |
| 1912 | 125.8 |
| 1913 | 124.7 |
| 1914 | 126.6 |
| 1915 | 125.0 |
| 1916 | 123.4 |
| 1917 | 121.0 |
| 1918 | 119.8 |
| 1919 | 111.2 |
| 1920 | 117.9 |
| 1921 | 119.8 |
| 1922 | 111.2 |
| 1923 | 110.5 |
| 1924 | 110.9 |
| 1925 | 106.6 |
| 1926 | 102.6 |
| 1927 | 99.8 |
| 1928 | 93.8 |
| 1929 | 89.3 |
| 1930 | 89.2 |
| 1931 | 84.6 |
| 1932 | 81.7 |
| 1933 | 76.3 |
| 1934 | 78.5 |
| 1935 | 77.2 |
| 1936 | 75.8 |
| 1937 | 77.1 |
| 1938 | 79.1 |
| 1939 | 77.6 |
| 1940 | 79.9 |
| 1941 | 83.4 |
| 1942 | 91.5 |
| 1943 | 94.3 |
| 1944 | 88.8 |
| 1945 | 85.9 |
| 1946 | 101.9 |
| 1947 | 113.3 |
| 1948 | 107.3 |
| 1949 | 107.1 |
| 1950 | 106.2 |
| 1951 | 111.5 |
| 1952 | 113.9 |
| 1953 | 115.2 |
| 1954 | 118.1 |
| 1955 | 118.3 |
| 1956 | 121.2 |
| 1957 | 122.9 |
| 1958 | 120.2 |
| 1959 | 118.8 |
| 1960 | 118.0 |
| 1961 | 117.1 |
| 1962 | 112.0 |
| 1963 | 108.3 |
| 1964 | 104.7 |
| 1965 | 96.3 |
| 1966 | 90.8 |
| 1967 | 87.2 |
| 1968 | 85.2 |
| 1969 | 86.1 |
| 1970 | 87.9 |
| 1971 | 81.6 |
| 1972 | 73.1 |
| 1973 | 68.8 |
| 1974 | 67.8 |
| 1975 | 66.0 |
| 1976 | 65.0 |
| 1977 | 66.8 |
| 1978 | 65.5 |
| 1979 | 67.2 |
| 1980 | 68.4 |
| 1981 | 67.3 |
| 1982 | 67.3 |
| 1983 | 65.7 |
| 1984 | 65.5 |
| 1985 | 66.3 |
| 1986 | 65.4 |
| 1987 | 65.8 |
| 1988 | 67.3 |
| 1989 | 69.2 |
| 1990 | 70.9 |
| 1991 | 69.3 |
| 1992 | 68.4 |
| 1993 | 67.0 |
| 1994 | 65.9 |
| 1995 | 64.6 |
| 1996 | 64.1 |
| 1997 | 63.6 |
| 1998 | 64.3 |
| 1999 | 64.4 |
| 2000 | 65.9 |
| 2001 | 65.1 |
| 2002 | 65.0 |
| 2003 | 66.1 |
| 2004 | 66.4 |
| 2005 | 66.7 |
| 2006 | 68.6 |
| 2007 | 69.3 |
| 2008 | 68.1 |
| 2009 | 66.2 |
| 2010 | 64.1 |
| 2011 | 63.2 |
| 2012 | 63.0 |
| 2013 | 62.5 |
| 2014 | 62.9 |
| 2015 | 62.5 |
| 2016 | 62.0 |
| 2017 | 60.3 |
| 2018 | 59.1 |
| 2019 | 58.3 |
| 2020 | 55.7 |
| 2021 | 56.3 |
| 2022 | 56.0 |
| 2023 | 54.5 |
The data shows the U.S. general fertility rate peaked in 1957 at 122.9 births per 1,000 women aged 15–44.
By 2023, that rate had fallen to 54.5—less than half the mid-century high. The sharpest declines came post-1960s, but the downward trend continues in the modern era.
Why Are Fertility Rates Falling?
Declining fertility rates are tied to a range of factors: economic pressures, access to contraception, shifts in social norms, delayed marriage and childbirth, and more women pursuing higher education and careers.
This broader trend reflects a transformation in how, when, and if Americans choose to have children.
Births Are Shifting to Older Age Groups
An important dynamic behind this trend is the shifting age profile of new mothers.
As of 2005, women aged 25–29 had the highest birth rates, at 116.5 births per 1,000 women. By 2023, the peak had shifted to the 30–34 age group, which logged 95.1 births per 1,000 women.
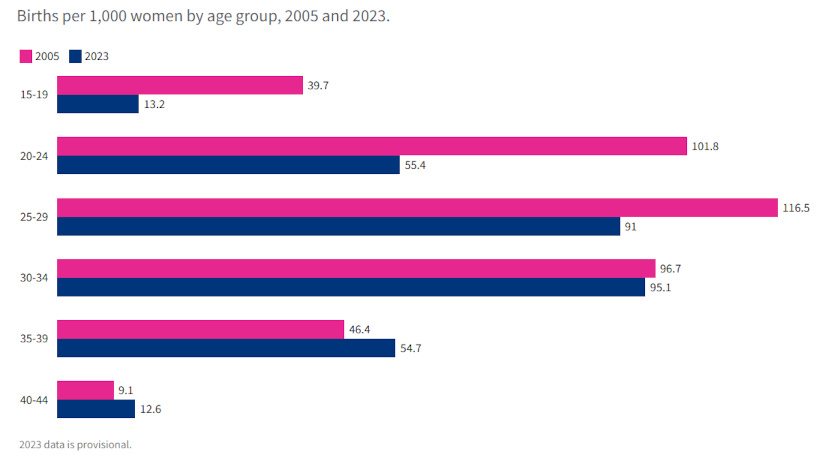
Between 2005 and 2023, fertility declined for women under 35, while increasing for those 35 and older. This demographic shift reflects later-life planning and improvements in maternal health options for older women.
Learn More on the Voronoi App ![]()
Want to dive deeper? Check out the companion piece showing how fertility rates have changed across all 50 states: Fertility Rates Decreased Nationwide from 2005 to 2022.