![]()
See this visualization first on the Voronoi app.
Use This Visualization
Visualizing U.S. vs. International Stock Market Performance
This was originally posted on our Voronoi app. Download the app for free on iOS or Android and discover incredible data-driven charts from a variety of trusted sources.
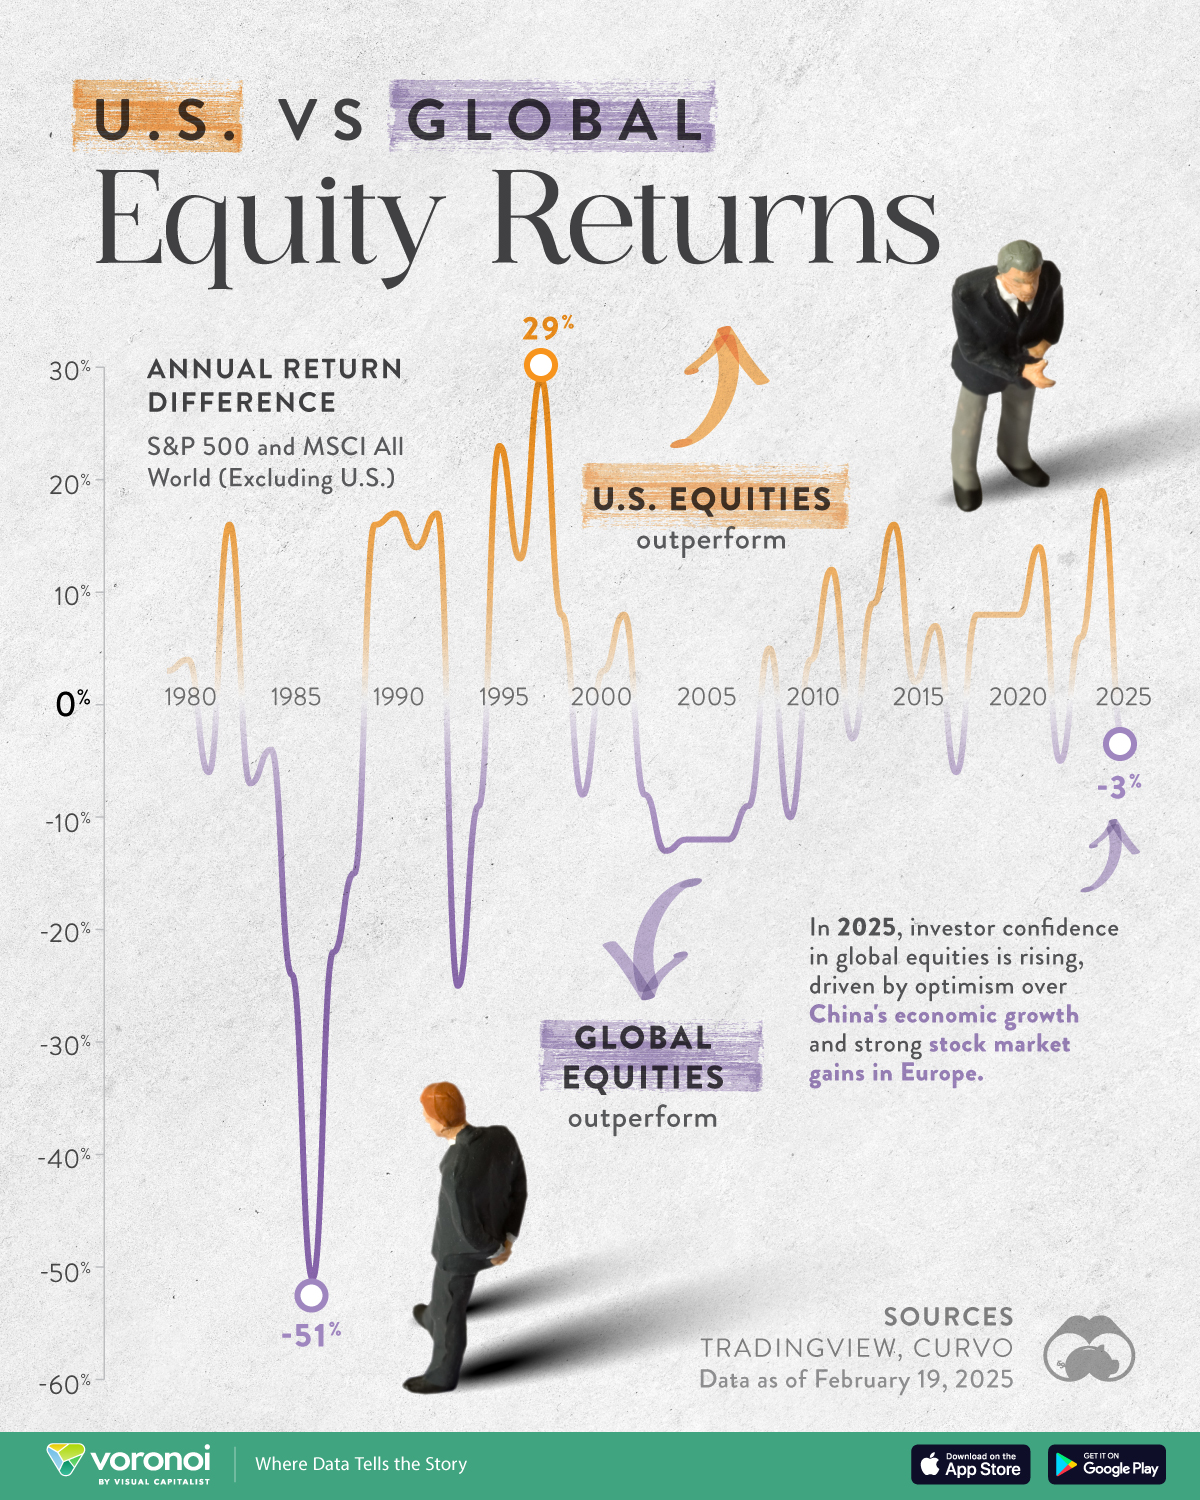
So far in 2025, international stocks are outperforming the S&P 500, despite U.S. stocks hitting record highs.
Investors are becoming increasingly bullish on global equities, with European stocks seeing the strongest monthly returns against the S&P 500 in January in a decade. Meanwhile, optimism is building around China’s recovery, even as tariff uncertainties loom.
This graphic shows the performance of U.S. stocks versus global stocks since 1979, based on data from multiple sources.
International Stocks Make a Comeback in 2025
Today, international stocks are largely unfazed by the Trump administration’s new playbook, amid peace negotiations on the wars in Ukraine and Gaza.
Instead, Germany’s DAX index hit fresh highs in February ahead of the election. In particular, defense stocks posted strong gains as European leaders discussed providing more military support to Ukraine.
Meanwhile, the Hong Hong stock market has surged, driven by a rally in Chinese tech stocks. As a result, global equities have returned 7.2% to-date while the S&P 500 has returned 4.5% as of February 19.
| Year | S&P 500Yearly Return | MSCI All World ex U.S.Yearly Return | Difference |
|---|---|---|---|
| 2025* | 4.5% | 7.2% | -2.7% |
| 2024 | 23.9% | 4.7% | 19.2% |
| 2023 | 23.8% | 17.9% | 5.8% |
| 2022 | -19.6% | -14.3% | -5.4% |
| 2021 | 26.6% | 12.6% | 14.0% |
| 2020 | 15.8% | 7.6% | 8.2% |
| 2019 | 30.4% | 22.5% | 7.9% |
| 2018 | -6.6% | -14.1% | 7.5% |
| 2017 | 18.7% | 24.2% | -5.5% |
| 2016 | 9.8% | 2.7% | 7.1% |
| 2015 | -0.7% | -3.0% | 2.3% |
| 2014 | 11.5% | -4.3% | 15.9% |
| 2013 | 29.6% | 21.0% | 8.6% |
| 2012 | 13.3% | 16.4% | -3.1% |
| 2011 | 0.0% | -12.2% | 12.2% |
| 2010 | 12.6% | 8.9% | 3.7% |
| 2009 | 23.5% | 33.7% | -10.2% |
| 2008 | -38.5% | -43.6% | 5.1% |
| 2007 | 3.5% | 12.4% | -8.9% |
| 2006 | 13.3% | 25.7% | -12.4% |
| 2005 | 2.9% | 14.5% | -11.6% |
| 2004 | 8.9% | 20.4% | -11.5% |
| 2003 | 26.1% | 39.4% | -13.3% |
| 2002 | -23.5% | -15.8% | -7.7% |
| 2001 | -13.0% | -21.4% | 8.4% |
| 2000 | -10.2% | -13.4% | 3.1% |
| 1999 | 19.5% | 27.9% | -8.4% |
| 1998 | 26.7% | 18.8% | 7.9% |
| 1997 | 31.0% | 2.3% | 28.7% |
| 1996 | 20.3% | 6.9% | 13.4% |
| 1995 | 34.1% | 11.4% | 22.7% |
| 1994 | -1.1% | 7.3% | -8.5% |
| 1993 | 7.1% | 32.2% | -25.2% |
| 1992 | 4.5% | -12.3% | 16.8% |
| 1991 | 26.3% | 12.0% | 14.3% |
| 1990 | -6.6% | -23.1% | 16.5% |
| 1989 | 27.3% | 11.1% | 16.1% |
| 1988 | 12.4% | 27.5% | -15.1% |
| 1987 | 2.0% | 24.2% | -22.2% |
| 1986 | 14.1% | 65.3% | -51.2% |
| 1985 | 26.4% | 50.8% | -24.4% |
| 1984 | -0.6% | 2.9% | -3.6% |
| 1983 | 17.3% | 23.8% | -6.6% |
| 1982 | 14.7% | -1.3% | 16.0% |
| 1981 | -9.9% | -3.9% | -6.0% |
| 1980 | 27.5% | 23.5% | 4.0% |
| 1979 | 12.3% | 9.4% | 2.9% |
*Data as of February 19, 2025
Over the past 10 years, the S&P 500 has averaged 13.8% in annualized returns while global stocks have averaged 4.9%.
These outsized returns have been largely fueled by American tech giants, but as the market soars to new heights, some question how much room there is left to run. By comparison, global stocks have more attractive valuations compared to expensive U.S. stocks.
The last time international stocks outperformed U.S. equities was during the 2000s, marked by the dot-com crash and the global financial crisis. During this time, China’s economic growth drove global equity returns while the S&P 500 lagged.
As the above table shows, international stocks have cycles of outperformance. Between 2000 and 2009, for instance, the growth of $1,000 invested in the MSCI Emerging Markets Index with dividends reinvested grew to $1,982 while an investment in U.S. stocks fell to $764.
Similarly, in the mid-1980s, international stocks gained over U.S. equities amid Japan’s rapid ascent. Adding to this, the 1985 Plaza Accord, a global agreement to weaken the U.S. dollar, led global currencies to rise significantly against the dollar.
Will Global Equity Outperformance Continue?
Looking ahead, international stocks possess many tailwinds, which could support equity performance in the years to come.
India, the world’s most populous country, is seeing significant economic growth thanks to favorable demographic factors. Today, more households in India have disposable income in excess of $10,000 than in Japan.
Meanwhile, China is home to a number of highly innovative firms across e-commerce, automotive, and health care industries which are increasingly making up a growing share of global markets.
While property market troubles and the lingering effects of COVID-19 lockdowns have depressed prices of many Chinese stocks, it may present an upside for future returns given their historically low valuations in comparison to those in developed markets.
Learn More on the Voronoi App ![]()
To learn more about this topic from a performance perspective, check out this graphic on over 30 years of global equity returns.
The post Charted: The U.S. Stock Market vs. Rest of World (1979-2025) appeared first on Visual Capitalist.