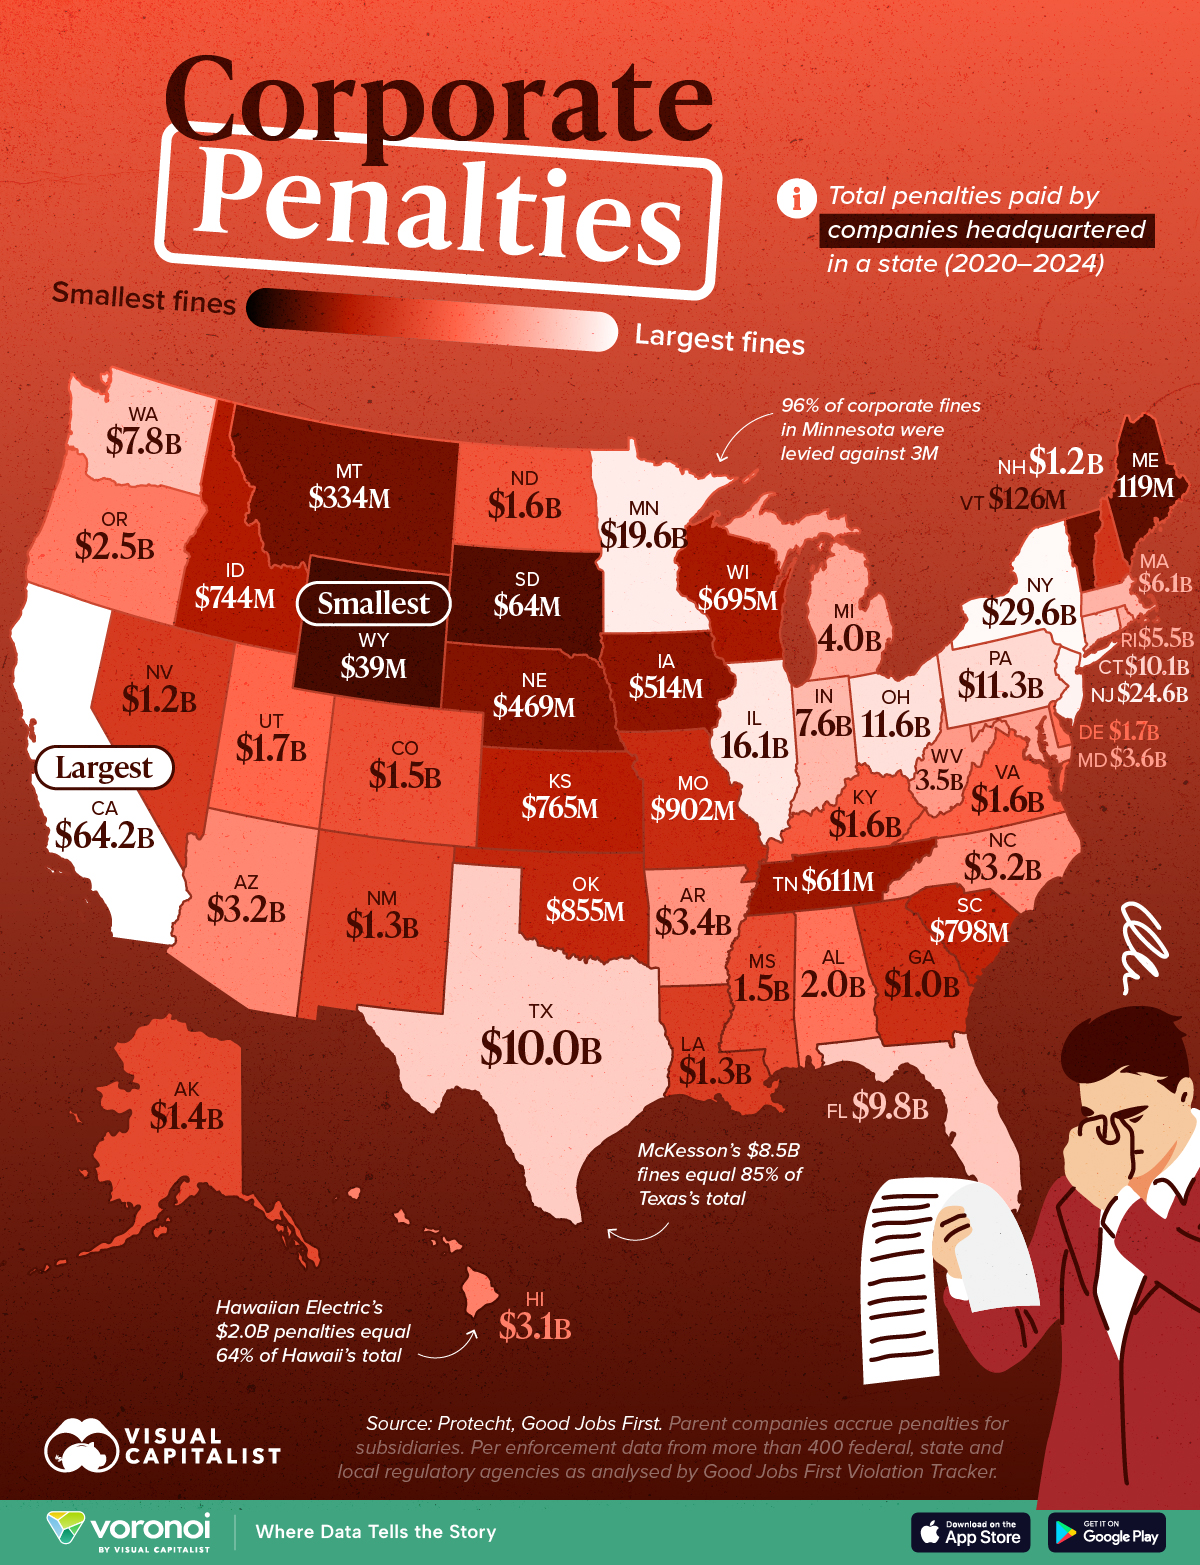
Charted: The Cost of Sitting Out the Market
Published
6 mins ago
on
May 27, 2025
| 724 views
-->
By
Julia Wendling
Article & Editing
- Ryan Bellefontaine
Graphics & Design
Published
6 mins ago
on
May 27, 2025
| 724 views
-->
By
Julia Wendling
Article & Editing
Graphics & Design
See this visualization first on the Voronoi app.
Use This Visualization
Charted: The Energy Demand of U.S. Data Centers
This was originally posted on our Voronoi app. Download the app for free on iOS or Android and discover incredible data-driven charts from a variety of trusted sources.
Published
34 mins ago
on
May 27, 2025
| 15 views
-->
By
Julia Wendling
Graphics & Design
See this visualization first on the Voronoi app.
Use This Visualization
Charted: U.S. Employment by Industry in 2025
This was originally posted on our Voronoi app. Download the app for free on iOS or Android and discover incredible data-driven charts from a variety of trusted sources.
Published
56 mins ago
on
May 22, 2025
| 86 views
-->
By
Julia Wendling
Graphics & Design