![]()
See this visualization first on the Voronoi app.
When Will the Global Population Start to Shrink?
This was originally posted on our Voronoi app. Download the app for free on iOS or Android and discover incredible data-driven charts from a variety of trusted sources.
Everyone alive today has only ever lived in a world with a growing population. And for the opposite to be true, the number of people being born would have to be outpaced by the number of people dying.
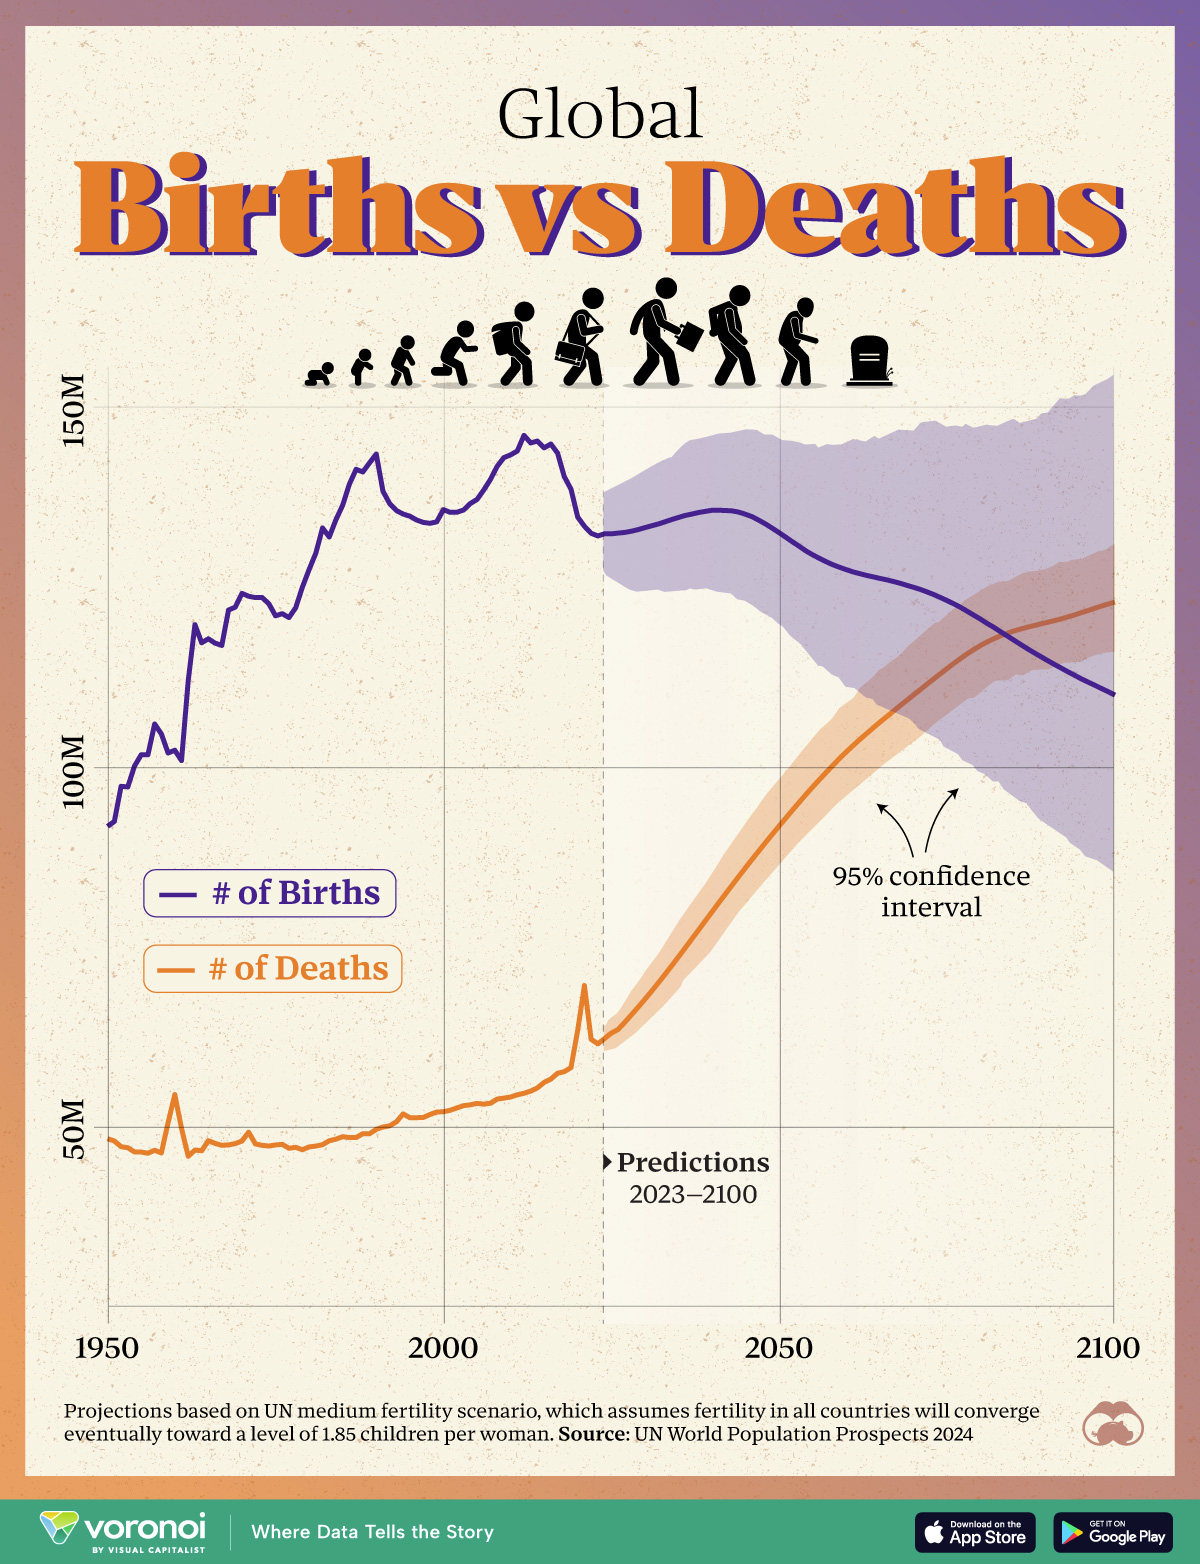
As it happens, that particular inflection point is not too far off according to latest estimates. We visualize the latest UN forecasts for the number of global births and deaths. Figures were sourced from the UN’s World Population Prospects 2024.
Global Births and Deaths (1950–2100)
In 2023, 132 million babies were born and nearly 62 million people died. Resulting in a population growth of 70 million people (+0.9%).
But as birth rates fall around the world, the number of deaths occurring each year is expected to surpass the number of births by 2084. This could potentially kick off an era of global population decline.
| Year | Global Births | Global Deaths | Population Growth / Decline |
|---|---|---|---|
| 1950 | 91,824,000 | 48,487,000 | +43,337,000 |
| 1951 | 92,507,000 | 48,176,000 | +44,331,000 |
| 1952 | 97,371,000 | 47,383,000 | +49,988,000 |
| 1953 | 97,291,000 | 47,240,000 | +50,051,000 |
| 1954 | 100,188,000 | 46,662,000 | +53,526,000 |
| 1955 | 101,748,000 | 46,636,000 | +55,112,000 |
| 1956 | 101,759,000 | 46,479,000 | +55,280,000 |
| 1957 | 106,018,000 | 46,881,000 | +59,137,000 |
| 1958 | 104,644,000 | 46,518,000 | +58,126,000 |
| 1959 | 102,000,000 | 50,725,000 | +51,275,000 |
| 1960 | 102,378,000 | 54,612,000 | +47,766,000 |
| 1961 | 100,951,000 | 49,919,000 | +51,032,000 |
| 1962 | 112,039,000 | 46,061,000 | +65,978,000 |
| 1963 | 119,803,000 | 46,913,000 | +72,890,000 |
| 1964 | 117,292,000 | 46,823,000 | +70,469,000 |
| 1965 | 117,837,000 | 48,214,000 | +69,623,000 |
| 1966 | 117,233,000 | 47,842,000 | +69,391,000 |
| 1967 | 116,920,000 | 47,569,000 | +69,351,000 |
| 1968 | 121,826,000 | 47,629,000 | +74,197,000 |
| 1969 | 122,228,000 | 47,816,000 | +74,412,000 |
| 1970 | 124,136,000 | 48,163,000 | +75,973,000 |
| 1971 | 123,740,000 | 49,384,000 | +74,356,000 |
| 1972 | 123,554,000 | 47,770,000 | +75,784,000 |
| 1973 | 123,564,000 | 47,573,000 | +75,991,000 |
| 1974 | 122,709,000 | 47,478,000 | +75,231,000 |
| 1975 | 121,030,000 | 47,623,000 | +73,407,000 |
| 1976 | 121,322,000 | 47,707,000 | +73,615,000 |
| 1977 | 120,787,000 | 47,167,000 | +73,620,000 |
| 1978 | 122,141,000 | 47,293,000 | +74,848,000 |
| 1979 | 125,000,000 | 46,964,000 | +78,036,000 |
| 1980 | 127,447,000 | 47,350,000 | +80,097,000 |
| 1981 | 129,716,000 | 47,471,000 | +82,245,000 |
| 1982 | 133,207,000 | 47,659,000 | +85,548,000 |
| 1983 | 131,968,000 | 48,207,000 | +83,761,000 |
| 1984 | 134,365,000 | 48,431,000 | +85,934,000 |
| 1985 | 136,374,000 | 48,773,000 | +87,601,000 |
| 1986 | 139,301,000 | 48,644,000 | +90,657,000 |
| 1987 | 141,347,000 | 48,657,000 | +92,690,000 |
| 1988 | 140,986,000 | 49,183,000 | +91,803,000 |
| 1989 | 142,249,000 | 49,178,000 | +93,071,000 |
| 1990 | 143,461,000 | 49,794,000 | +93,667,000 |
| 1991 | 138,307,000 | 50,108,000 | +88,199,000 |
| 1992 | 136,591,000 | 50,282,000 | +86,309,000 |
| 1993 | 135,632,000 | 50,832,000 | +84,800,000 |
| 1994 | 135,143,000 | 51,931,000 | +83,212,000 |
| 1995 | 134,850,000 | 51,407,000 | +83,443,000 |
| 1996 | 134,321,000 | 51,411,000 | +82,910,000 |
| 1997 | 133,986,000 | 51,432,000 | +82,554,000 |
| 1998 | 133,858,000 | 51,854,000 | +82,004,000 |
| 1999 | 134,059,000 | 52,184,000 | +81,875,000 |
| 2000 | 135,758,000 | 52,240,000 | +83,518,000 |
| 2001 | 135,380,000 | 52,431,000 | +82,949,000 |
| 2002 | 135,396,000 | 52,758,000 | +82,638,000 |
| 2003 | 135,701,000 | 53,077,000 | +82,624,000 |
| 2004 | 136,596,000 | 53,188,000 | +83,408,000 |
| 2005 | 137,166,000 | 53,390,000 | +83,776,000 |
| 2006 | 138,469,000 | 53,282,000 | +85,187,000 |
| 2007 | 139,936,000 | 53,410,000 | +86,526,000 |
| 2008 | 141,759,000 | 53,987,000 | +87,772,000 |
| 2009 | 142,968,000 | 54,123,000 | +88,845,000 |
| 2010 | 143,354,000 | 54,269,000 | +89,085,000 |
| 2011 | 143,879,000 | 54,581,000 | +89,298,000 |
| 2012 | 146,055,000 | 54,795,000 | +91,260,000 |
| 2013 | 145,015,000 | 55,093,000 | +89,922,000 |
| 2014 | 145,268,000 | 55,545,000 | +89,723,000 |
| 2015 | 144,334,000 | 56,306,000 | +88,028,000 |
| 2016 | 144,854,000 | 56,757,000 | +88,097,000 |
| 2017 | 143,602,000 | 57,572,000 | +86,030,000 |
| 2018 | 140,333,000 | 57,793,000 | +82,540,000 |
| 2019 | 138,597,000 | 58,355,000 | +80,242,000 |
| 2020 | 134,720,000 | 63,546,000 | +71,174,000 |
| 2021 | 133,449,000 | 69,728,000 | +63,721,000 |
| 2022 | 132,475,000 | 62,279,000 | +70,196,000 |
| 2023 | 132,110,000 | 61,652,000 | +70,458,000 |
| 2024 | 132,406,000 | 62,389,000 | +70,017,000 |
| 2025 | 132,399,000 | 63,136,000 | +69,263,000 |
| 2026 | 132,503,000 | 63,637,000 | +68,866,000 |
| 2027 | 132,591,000 | 64,626,000 | +67,965,000 |
| 2028 | 132,761,000 | 65,678,000 | +67,083,000 |
| 2029 | 132,989,000 | 66,739,000 | +66,250,000 |
| 2030 | 133,256,000 | 67,827,000 | +65,429,000 |
| 2031 | 133,513,000 | 68,954,000 | +64,559,000 |
| 2032 | 133,765,000 | 70,103,000 | +63,662,000 |
| 2033 | 134,065,000 | 71,289,000 | +62,776,000 |
| 2034 | 134,381,000 | 72,486,000 | +61,895,000 |
| 2035 | 134,669,000 | 73,714,000 | +60,955,000 |
| 2036 | 134,946,000 | 74,948,000 | +59,998,000 |
| 2037 | 135,141,000 | 76,206,000 | +58,935,000 |
| 2038 | 135,355,000 | 77,450,000 | +57,905,000 |
| 2039 | 135,515,000 | 78,710,000 | +56,805,000 |
| 2040 | 135,669,000 | 79,951,000 | +55,718,000 |
| 2041 | 135,673,000 | 81,209,000 | +54,464,000 |
| 2042 | 135,636,000 | 82,443,000 | +53,193,000 |
| 2043 | 135,581,000 | 83,672,000 | +51,909,000 |
| 2044 | 135,407,000 | 84,890,000 | +50,517,000 |
| 2045 | 135,109,000 | 86,093,000 | +49,016,000 |
| 2046 | 134,764,000 | 87,282,000 | +47,482,000 |
| 2047 | 134,271,000 | 88,448,000 | +45,823,000 |
| 2048 | 133,752,000 | 89,607,000 | +44,145,000 |
| 2049 | 133,163,000 | 90,746,000 | +42,417,000 |
| 2050 | 132,555,000 | 91,877,000 | +40,678,000 |
| 2051 | 131,923,000 | 92,986,000 | +38,937,000 |
| 2052 | 131,280,000 | 94,084,000 | +37,196,000 |
| 2053 | 130,667,000 | 95,173,000 | +35,494,000 |
| 2054 | 130,020,000 | 96,249,000 | +33,771,000 |
| 2055 | 129,485,000 | 97,293,000 | +32,192,000 |
| 2056 | 128,995,000 | 98,309,000 | +30,686,000 |
| 2057 | 128,531,000 | 99,310,000 | +29,221,000 |
| 2058 | 128,110,000 | 100,283,000 | +27,827,000 |
| 2059 | 127,755,000 | 101,242,000 | +26,513,000 |
| 2060 | 127,431,000 | 102,157,000 | +25,274,000 |
| 2061 | 127,117,000 | 103,025,000 | +24,092,000 |
| 2062 | 126,876,000 | 103,870,000 | +23,006,000 |
| 2063 | 126,635,000 | 104,678,000 | +21,957,000 |
| 2064 | 126,430,000 | 105,485,000 | +20,945,000 |
| 2065 | 126,218,000 | 106,273,000 | +19,945,000 |
| 2066 | 126,019,000 | 107,032,000 | +18,987,000 |
| 2067 | 125,793,000 | 107,799,000 | +17,994,000 |
| 2068 | 125,547,000 | 108,554,000 | +16,993,000 |
| 2069 | 125,260,000 | 109,292,000 | +15,968,000 |
| 2070 | 124,986,000 | 110,035,000 | +14,951,000 |
| 2071 | 124,696,000 | 110,770,000 | +13,926,000 |
| 2072 | 124,348,000 | 111,529,000 | +12,819,000 |
| 2073 | 123,982,000 | 112,258,000 | +11,724,000 |
| 2074 | 123,573,000 | 112,984,000 | +10,589,000 |
| 2075 | 123,140,000 | 113,707,000 | +9,433,000 |
| 2076 | 122,693,000 | 114,417,000 | +8,276,000 |
| 2077 | 122,209,000 | 115,099,000 | +7,110,000 |
| 2078 | 121,660,000 | 115,749,000 | +5,911,000 |
| 2079 | 121,107,000 | 116,357,000 | +4,750,000 |
| 2080 | 120,555,000 | 116,924,000 | +3,631,000 |
| 2081 | 119,955,000 | 117,418,000 | +2,537,000 |
| 2082 | 119,412,000 | 117,862,000 | +1,550,000 |
| 2083 | 118,804,000 | 118,270,000 | +534,000 |
| 2084 | 118,220,000 | 118,619,000 | -399,000 |
| 2085 | 117,622,000 | 118,941,000 | -1,319,000 |
| 2086 | 117,028,000 | 119,206,000 | -2,178,000 |
| 2087 | 116,442,000 | 119,458,000 | -3,016,000 |
| 2088 | 115,886,000 | 119,684,000 | -3,798,000 |
| 2089 | 115,345,000 | 119,920,000 | -4,575,000 |
| 2090 | 114,805,000 | 120,136,000 | -5,331,000 |
| 2091 | 114,283,000 | 120,359,000 | -6,076,000 |
| 2092 | 113,773,000 | 120,604,000 | -6,831,000 |
| 2093 | 113,262,000 | 120,878,000 | -7,616,000 |
| 2094 | 112,773,000 | 121,154,000 | -8,381,000 |
| 2095 | 112,282,000 | 121,465,000 | -9,183,000 |
| 2096 | 111,831,000 | 121,754,000 | -9,923,000 |
| 2097 | 111,397,000 | 122,077,000 | -10,680,000 |
| 2098 | 110,941,000 | 122,380,000 | -11,439,000 |
| 2099 | 110,501,000 | 122,664,000 | -12,163,000 |
| 2100 | 110,028,000 | 122,922,000 | -12,894,000 |
Note: Columns can be sorted to see which years are expected to have declines.
By the year 2100, the UN estimates the global population could shrink by nearly 13 million people, roughly the current populace of Bolivia.
Of course, these estimates are not exact and occur within a 95% confidence interval. It’s a range within which the true values are expected to fall 95% of the time. At the uppermost band, births still outnumber deaths in the year 2100. At the lowermost band, population decline could start closer to 2060.
Why does this matter? Simply put, population decline is not a phenomenon the world economy is currently built for. It disrupts labor markets, strains social security systems, and threatens economic growth by reducing consumer demand. This can lead to a cycle of stagnation and increased debt.
On the other hand, it can result in reduced resource demand and extraction. With fewer people, education could see increased investment, resulting in a skilled workforce better equipped to changing economic needs.
Learn More on the Voronoi App ![]()
For more related content, check out out this chart which visualizes the old-age dependecy ratio for ten major economies in 2050.
The post Charted: When Will the Global Population Start to Shrink? appeared first on Visual Capitalist.