Published
4 seconds ago
on
September 1, 2023
| 47 views
-->
By
Dorothy Neufeld
Graphics & Design
- Pernia Jamshed
The following content is sponsored by New York Life Investments
Decoding the Economics of a Soft Landing
Is a soft landing on the horizon?
So far, the U.S. economy has illustrated unexpected strength, with S&P 500 returns up over 18% year-to-date. A resilient labor market and cooling inflation have improved the odds of the U.S. avoiding a recession, in spite of 11 interest rate hikes since March 2022.
This graphic, sponsored by New York Life Investments, shows three key factors that could impact whether the U.S. achieves a soft landing.
What is a Soft Landing?
Historically, after a steep rise in interest rates, the U.S. economy often falls into recession.
Still, there have been some exceptions where it avoided a sharp downturn. The most notable example was in 1994-1995, when the Fed raised interest rates seven times in one year without triggering a recession.
Consider the following general definitions:
- Soft landing: The Federal Reserve raises interest rates just enough to stabilize inflation. A recession is avoided, or only a minor one occurs.
- Hard landing: The Federal Reserve raises interest rates too far, excessively slowing the economy and causing a recession.
Below, we show the factors having an outsized influence on the health of the U.S. economy today.
1. The Labor Market
The U.S. labor market is an important indicator of economic health.
In July, there were 1.7 job openings for every unemployed person, highlighting strong demand for workers. In fact, almost 4 million jobs have been added since 2020, recovering the majority of jobs that were lost due to the pandemic.
At the same time, the U.S. unemployment rate remains near five-decade lows, sitting at just 3.5% as of July.
Why Does This Matter?
- Wages have been steadily rising, although not fast enough to significantly impact inflation.
- With no shortage of job options, this suggests economic strength, supporting a soft landing.
2. Inflation
Inflation has fallen to 3.2% in July, down from a peak of 8.9% seen in June 2022.
We can see in the table below that inflation has been stabilizing, but core inflation, which excludes food and energy, has been declining at a slower pace. The Fed watches core inflation more closely since it is less affected by short-term price fluctuations, and is therefore a better barometer of where prices are headed.
| Date | Inflation (%) | Inflation Excluding Food & Energy (%) |
|---|---|---|
| Jul 2023 | 3.2% | 4.7% |
| Jun 2023 | 3.1% | 4.9% |
| May 2023 | 4.1% | 5.3% |
| Apr 2023 | 5.0% | 5.5% |
| Mar 2023 | 5.0% | 5.6% |
| Feb 2023 | 6.0% | 5.5% |
| Jan 2023 | 6.3% | 5.5% |
| Dec 2022 | 6.4% | 5.7% |
| Nov 2022 | 7.1% | 6.0% |
| Oct 2022 | 7.8% | 6.3% |
| Sep 2022 | 8.2% | 6.6% |
| Aug 2022 | 8.2% | 6.3% |
| Jul 2022 | 8.4% | 5.9% |
| Jun 2022 | 8.9% | 5.9% |
| May 2022 | 8.5% | 6.0% |
| Apr 2022 | 8.2% | 6.1% |
| Mar 2022 | 8.5% | 6.5% |
| Feb 2022 | 8.0% | 6.4% |
| Jan 2022 | 7.6% | 6.1% |
| Dec 2021 | 7.2% | 5.5% |
| Nov 2021 | 6.9% | 5.0% |
| Oct 2021 | 6.2% | 4.6% |
| Sep 2021 | 5.4% | 4.0% |
| Aug 2021 | 5.2% | 3.9% |
| Jul 2021 | 5.2% | 4.2% |
| Jun 2021 | 5.3% | 4.4% |
| May 2021 | 4.9% | 3.8% |
| Apr 2021 | 4.1% | 3.0% |
| Mar 2021 | 2.6% | 1.7% |
| Feb 2021 | 1.7% | 1.3% |
| Jan 2021 | 1.4% | 1.4% |
| Dec 2020 | 1.3% | 1.6% |
| Nov 2020 | 1.2% | 1.7% |
| Oct 2020 | 1.2% | 1.6% |
| Sep 2020 | 1.4% | 1.7% |
| Aug 2020 | 1.3% | 1.7% |
| Jul 2020 | 1.0% | 1.5% |
| Jun 2020 | 0.7% | 1.2% |
| May 2020 | 0.2% | 1.2% |
| Apr 2020 | 0.3% | 1.4% |
| Mar 2020 | 1.5% | 2.1% |
| Feb 2020 | 2.3% | 2.4% |
| Jan 2020 | 2.5% | 2.3% |
Housing costs accounted for 90% of inflation’s increase in July, while food and energy costs increased slightly. And even though inflation remains above the 2% target set by the Federal Reserve, we can see that price pressures continue to be easing.
Why Does This Matter?
- If inflation continues to subside, the Federal Reserve may be able to cut interest rates.
- This could help pave the way toward a soft landing as lower borrowing costs support stock market performance.
3. Consumer Savings
Household spending makes up roughly two-thirds of U.S. GDP.
During the pandemic, excess savings—those that go beyond expected savings—hit historic levels. Analysis from the Federal Reserve shows that excess savings hit a peak of $2.1 trillion in August 2021, but have since fallen to $190 billion as of June this year.
Americans also had access to more liquid funds than before the pandemic. The table below shows household liquid assets by income level compared to pre-pandemic levels.
| Household Liquid Assets | Pre-Pandemic Average2016-2019 | Q4 2022 |
|---|---|---|
| Lowest Income Level Households | 24% | 33% |
| 2nd | 25% | 27% |
| 3rd | 19% | 21% |
| 4th | 14% | 16% |
| Highest Income Level Households | 13% | 15% |
Household income distribution from lowest 20% to highest 20%.
These liquid assets have likely provided a buffer for consumers in the face of rising costs and interest expenses. More liquid assets mean that consumers have the ability to spend more, supporting economic growth.
Why Does This Matter?
- Excess savings are projected to bolster consumer spending through the third quarter of 2023.
- This will support business investment and help prevent a rise in unemployment.
Soft Landing Playbook
Despite these positive signals, the full effects of rising interest rates may take time to filter through the economy. With this in mind, the following investments could help investors navigate interest rate uncertainty and mixed recession forecasts:
- Value equities: Historically have more stable earnings than growth equities.
- Pairing longer-dated and short-dated bonds: This type of bond strategy allows for investors to pivot if interest rates change, and to lock-in higher rates over longer horizons.
Together, these investments may allow investors to weather an unpredictable market environment.
![]()
Explore more investment insights with New York Life Investments.

Please enable JavaScript in your browser to complete this form.Enjoying the data visualization above? *Subscribe
Related Topics: #New York Life #soft landing #u.s. labor market #value equities #bonds #interest rates #New York Life Investments
Click for Comments
var disqus_shortname = "visualcapitalist.disqus.com";
var disqus_title = "Decoding the Economics of a Soft Landing";
var disqus_url = "https://www.visualcapitalist.com/sp/decoding-the-economics-of-a-soft-landing/";
var disqus_identifier = "visualcapitalist.disqus.com-160702";
You may also like
-
China1 week ago
Visualizing the Future Global Economy by GDP in 2050
Asia is expected to represent the world’s largest share of real GDP in 2050. See how this all breaks down in one chart.
-
Markets2 weeks ago
Visualized: U.S. Corporate Bankruptcies On the Rise
In 2023, over 400 companies have folded. This graphic shows how corporate bankruptcies are growing at the second-fastest rate since 2010.
-
Markets2 weeks ago
The 50 Most Valuable Companies in the World in 2023
The world’s 50 most valuable companies represent over $25 trillion in market cap. We break this massive figure down by company and sector.
-
Markets2 weeks ago
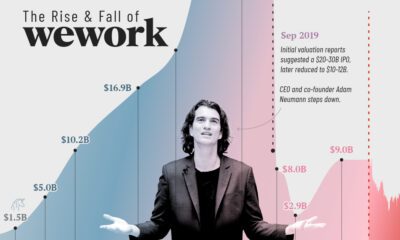
Charted: The Rise and Fall of WeWork
At the height of its success, WeWork was valued at $47 billion. Four years later, WeWork is worth a fraction of the total. What happened?
-

Markets2 weeks ago
Visualized: Which Airports Move the Most Cargo?
Cargo that moves through airports represents the value of around 35% of world trade. These hubs move the most cargo globally.
-
Markets3 weeks ago
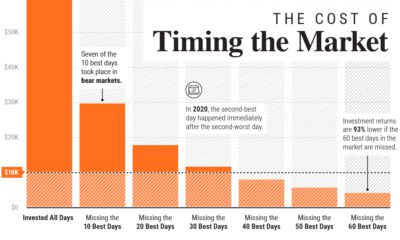
Timing the Market: Why It’s So Hard, in One Chart
In this graphic, we show why timing the market is extremely difficult, and how it can meaningfully dent portfolio returns.
Subscribe
Please enable JavaScript in your browser to complete this form.Join the 375,000+ subscribers who receive our daily email *Sign Up
The post Decoding the Economics of a Soft Landing appeared first on Visual Capitalist.