![]()
See more visualizations like this on the Voronoi app.
Use This Visualization
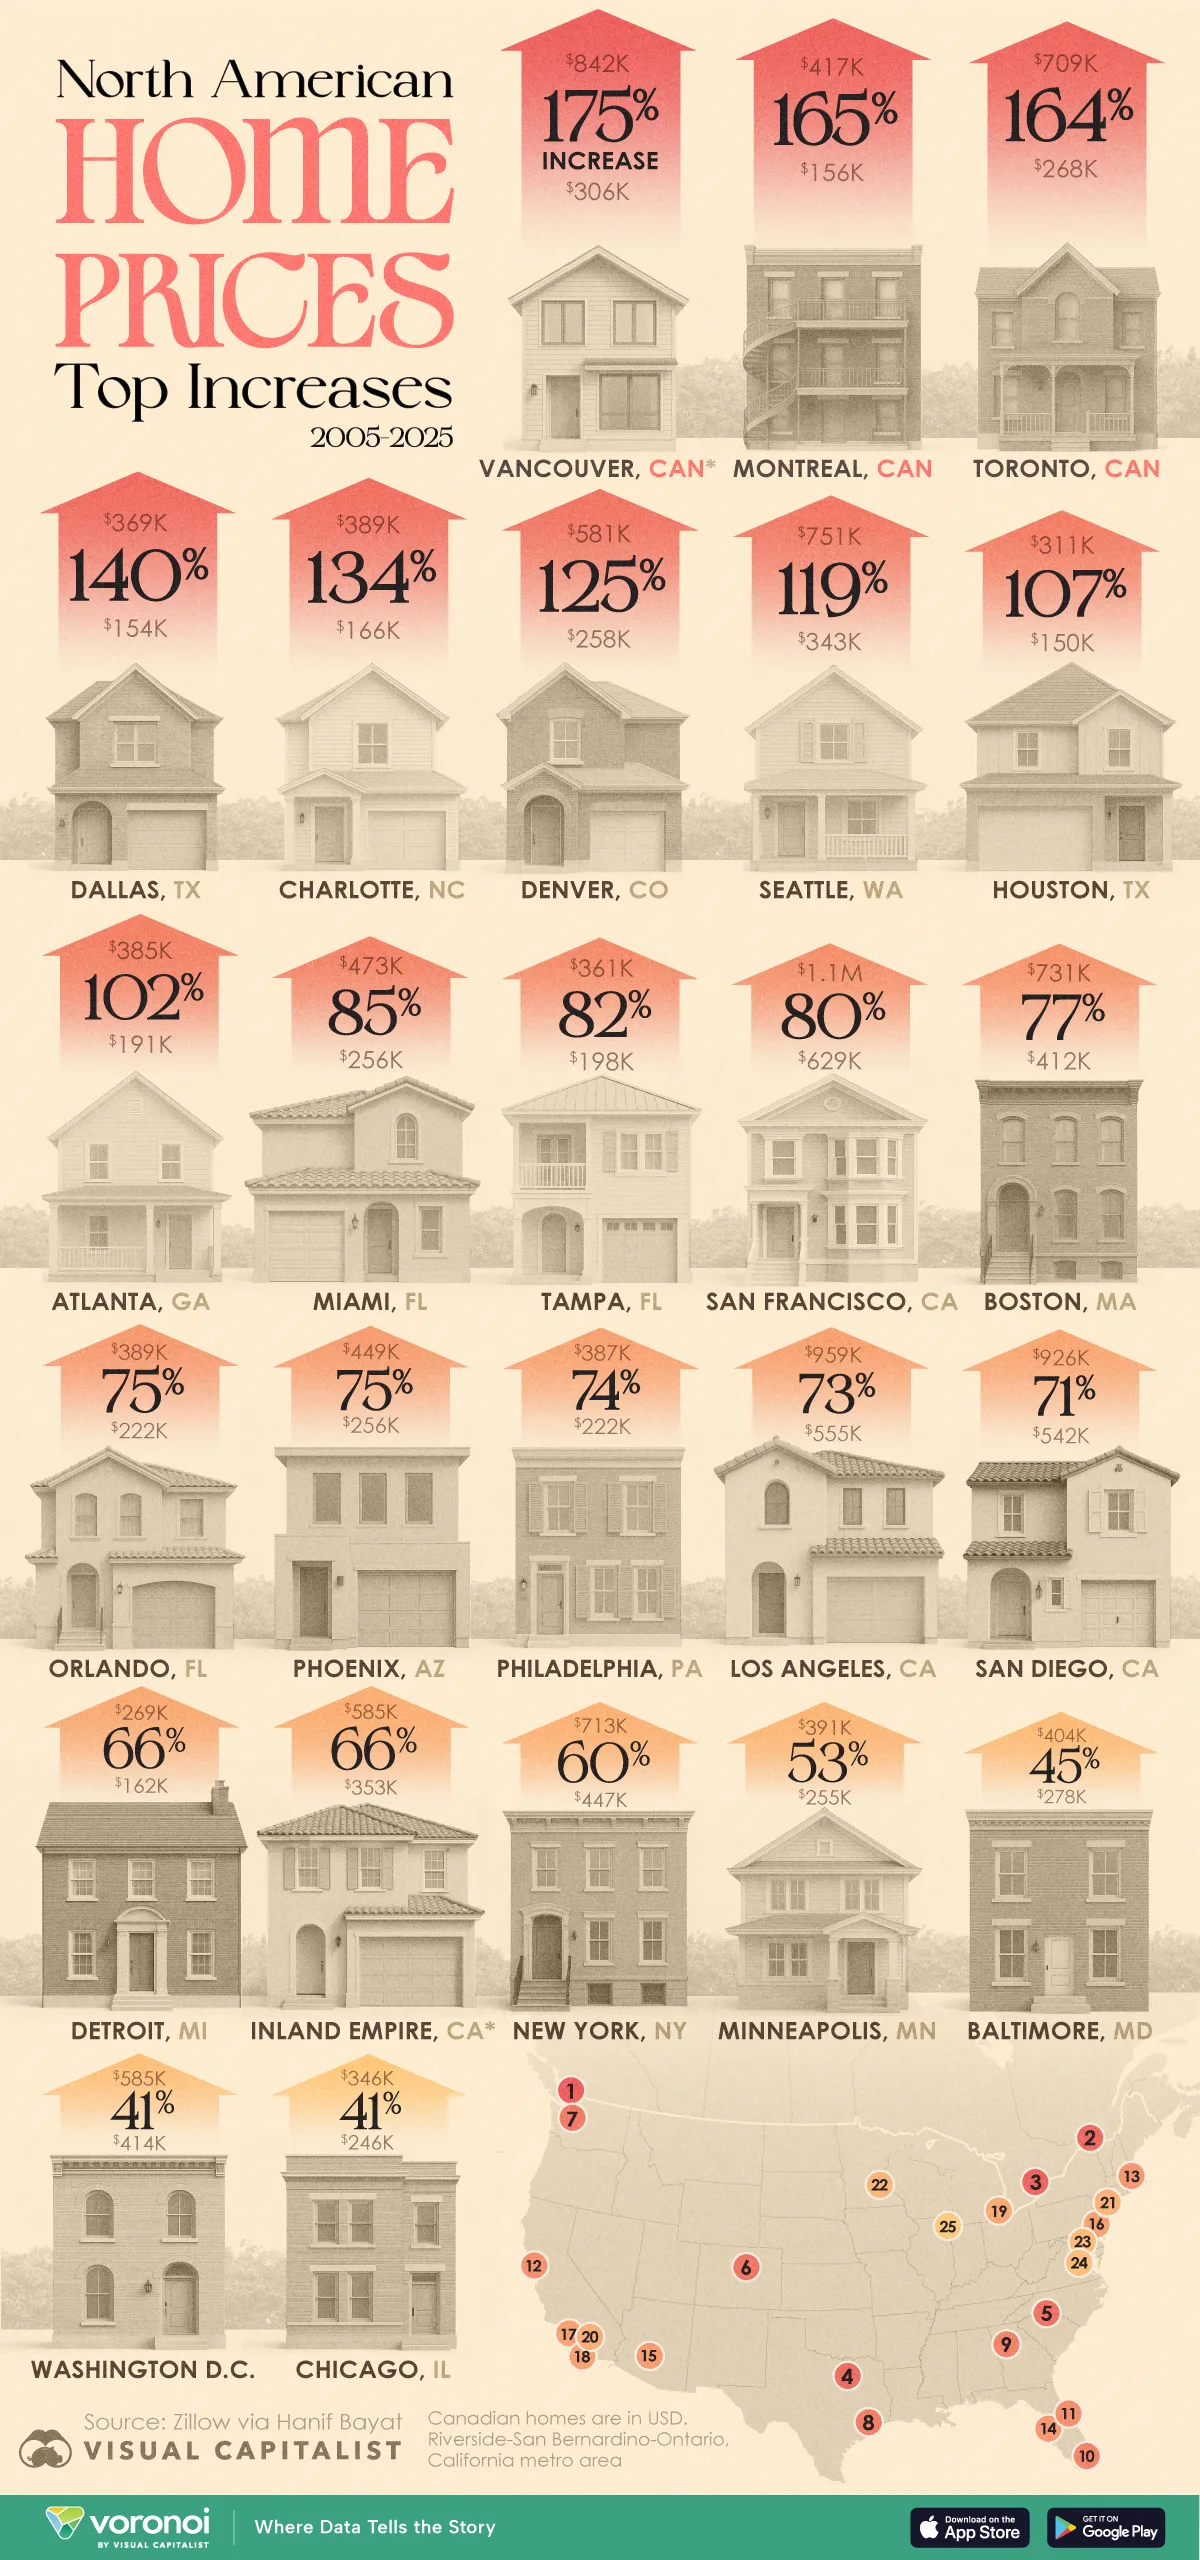
North American Cities With the Fastest Home Price Growth
See visuals like this from many other data creators on our Voronoi app. Download it for free on iOS or Android and discover incredible data-driven charts from a variety of trusted sources.
Key Takeaways
- Vancouver, Montreal, and Toronto saw the biggest home price increases, each rising more than 160% over the past 20 years.
- Southern metros like Dallas, Charlotte, and Denver rank among the fastest-growing U.S. housing markets.
- Major coastal cities like Los Angeles, San Francisco, and New York saw slower growth but are among the most expensive markets overall.
Home prices across North America have surged over the past two decades, driven by population growth, limited housing supply, and post-pandemic demand.
This infographic shows how average home prices have changed from July 2005 to July 2025 across 25 major North American cities, based on Zillow data compiled by Hanif Bayat.
Where Home Prices Have Risen the Most
On average, home prices across the top 25 cities in North America have risen by 92%, or nearly doubled, between 2005 and 2025.
The table below shows the North American cities where home prices have risen the most:
| City | Percentage change | Avg home price in July 2005 | Avg home price in July 2025 |
|---|---|---|---|
| Vancouver | 175% | $306,000 | $842,000 |
| Montreal | 167% | $156,000 | $417,000 |
| Toronto | 164% | $268,000 | $709,000 |
| Dallas | 139% | $154,000 | $369,000 |
| Charlotte | 134% | $166,000 | $389,000 |
| Denver | 125% | $258,000 | $581,000 |
| Seattle | 119% | $343,000 | $751,000 |
| Houston | 107% | $150,000 | $311,000 |
| Atlanta | 102% | $191,000 | $385,000 |
| Miami | 84% | $256,000 | $473,000 |
| Tampa | 83% | $198,000 | $361,000 |
| San Francisco | 79% | $629,000 | $1,130,000 |
| Boston | 77% | $412,000 | $731,000 |
| Orlando | 76% | $222,000 | $389,000 |
| Phoenix | 75% | $256,000 | $449,000 |
| Philadelphia | 74% | $222,000 | $387,000 |
| Los Angeles | 73% | $555,000 | $959,000 |
| San Diego | 71% | $542,000 | $926,000 |
| Inland Empire* | 66% | $353,000 | $585,000 |
| Detroit | 66% | $162,000 | $269,000 |
| New York | 59% | $447,000 | $713,000 |
| Minneapolis | 53% | $255,000 | $391,000 |
| Baltimore | 45% | $278,000 | $404,000 |
| Washington | 41% | $414,000 | $585,000 |
| Chicago | 41% | $246,000 | $346,000 |
*Inland Empire refers to Riverside-San Bernardino-Ontario, California metro area.
The top three fastest-appreciating cities are all in Canada. Vancouver leads with a 175% increase since 2005, followed by Montreal at 167% and Toronto with a 165% rise.
Canada’s big metros have experienced rapid population growth and strong foreign-buyer interest, combining to create some of the world’s hottest real estate markets. Vancouver and Toronto, in particular, have faced long-term housing shortages and rank among America’s least affordable housing markets.
In the United States, cities in the Sunbelt region in the South have seen their home prices more than double since 2005. These include Dallas (140%), Charlotte (134%), and Denver (125%), followed by Seattle (119%), which is the only more northern metro among the top five U.S. cities.
Houston and Atlanta have also seen strong growth in home prices, along with Miami and Tampa in Florida.
Coastal Cities Show Slower Home Price Growth
Despite being the three most expensive housing markets, major coastal cities like San Francisco (80%), Los Angeles (73%), and San Diego (71%) show relatively slower growth in home prices. On the East Coast, prices in New York have also grown moderately, rising 60% over the last two decades.
These coastal metros were already expensive in 2005, leaving less room for percentage-based appreciation as compared to Southern cities like Dallas and Houston.
Meanwhile, among the top 25 cities, home prices have grown slowest in Washington, D.C. and Chicago, rising 41% between 2005 and 2025.
Learn More on the Voronoi App ![]()
To learn more about this topic from a global perspective, see Home Prices and Rent Changes Around the World on Voronoi.