Published
1 hour ago
on
August 23, 2023
| 103 views
-->
By
Rida Khan
Graphics & Design
- Pernia Jamshed
The following content is sponsored by Fidelity Investments
Lessons from Recessions: The TSX During Financial Crises
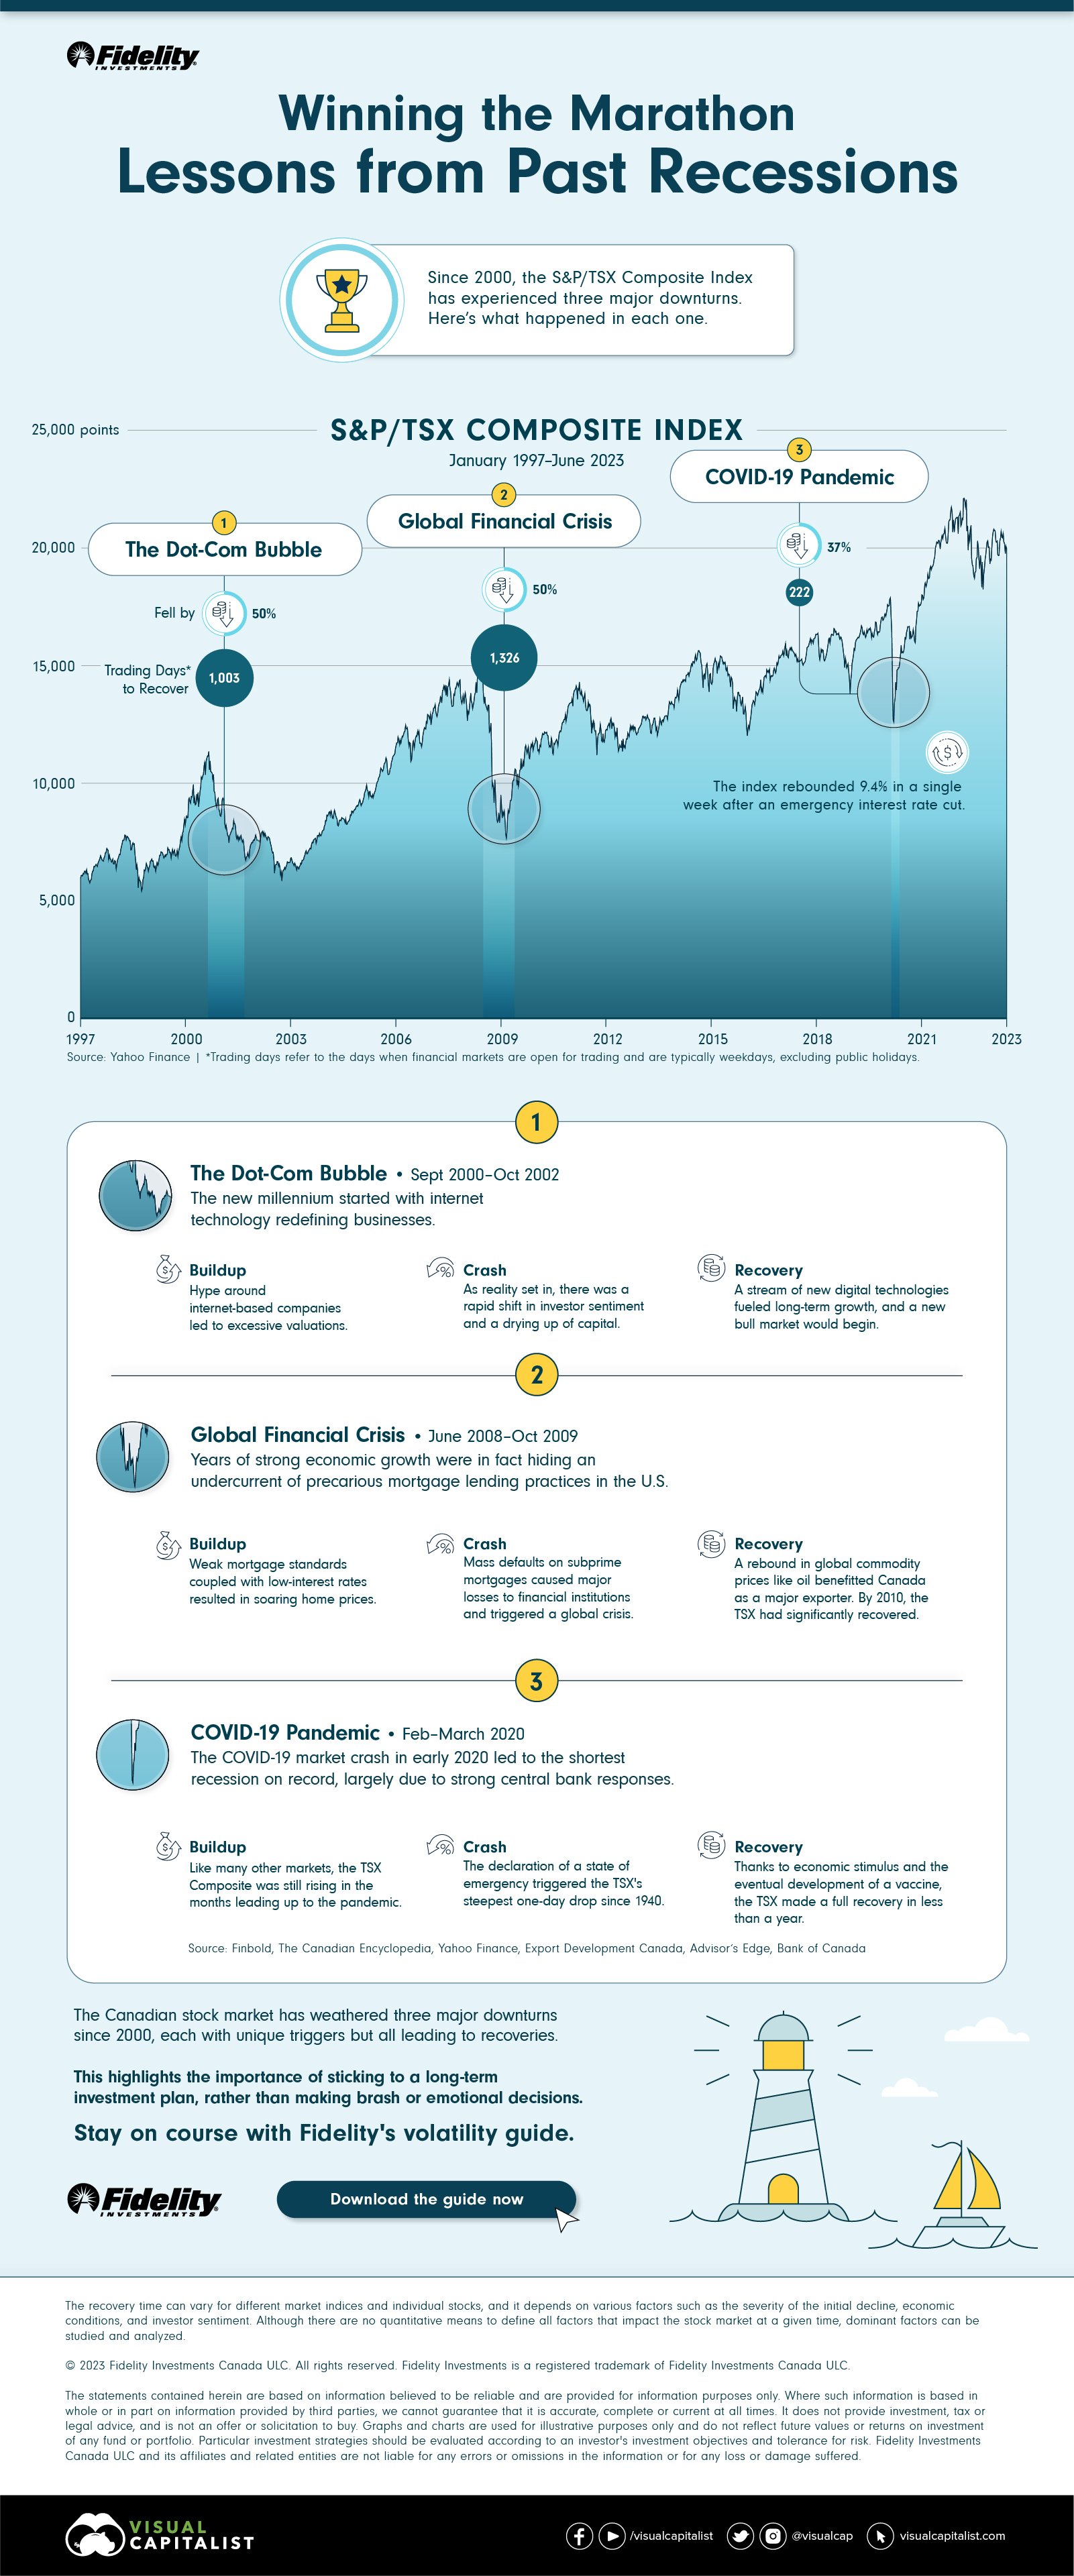
Since 2000, the Toronto Stock Exchange (TSX) has gone through three major downturns.
This infographic, sponsored by Fidelity Investments, explores the buildup, crash triggers, and subsequent recoveries from the three major downturns in the S&P/TSX Composite Index, the benchmark Canadian index.
The Three Downturns
Following historical data from Yahoo Finance, here’s a closer look at the three financial crises that led to downturns, impacting the TSX Composite between 2000 and 2022.
1) The Dot-Com Bubble
The new millennium started with internet technology redefining businesses.
Buildup: The hype and speculation surrounding the internet’s vast potential formed a bubble, leading to inflated stock prices despite many companies lacking profits or revenue.
Market Crash: As reality took hold, investor sentiment swiftly shifted, triggering rapid sell-offs. From September 2000 to October 2002, the TSX Composite fell by 50%.
Venture capitalist Fred Wilson said:
“Much of the capital invested was lost, but also much of it was invested in a very high throughput backbone for the Internet…All that stuff has allowed what we have today, which has changed our lives.”
Recovery: Investments were reevaluated, while new digital technologies were also emerging. This ignited a resurgence that laid the groundwork for a new bull market. However, it took over 1,000 trading days to recover.
2. Global Financial Crisis
The global financial crisis that started in 2007 brought this about.
Buildup: High-risk mortgage lending and inadequate regulatory oversight in the U.S. led to a chain reaction of bank failures, credit freezes, and economic contraction.
Market Crash: The implosion of subprime mortgages sent shockwaves through financial markets worldwide, including in Canada. From June 2008 to March 2009, the TSX fell by 50%.
Recovery: The index took more than 1,300 trading days to recover, but Canada’s export-oriented economy benefited from the resurgence of global commodity prices.
Interestingly, while Canada suffered an equally dramatic economic collapse as the U.S., none of its banks failed due to a well-regulated system of large financial institutions. In contrast, the U.S. had a fragmented setup with numerous smaller banks overseen by competing regulators.
3. COVID-19 Pandemic
In 2020, a new challenge arose—the COVID-19 pandemic, impacting global economies and leading to short but jolting recessions around the globe.
Buildup: Similar to other indices, the TSX Composite was ascending in the months preceding the pandemic.
Market Crash: The declaration of a state of emergency triggered the TSX’s sharpest one-day drop since 1940 of over 12%. Within weeks, the index fell by 37%.
Recovery: With an emergency interest rate cut, the index rebounded by 9.4% in a week. With economic stimulus policies and vaccine development efforts, the TSX Composite recovered in 222 trading days.
The Lessons
While each downturn has distinct triggers, historical patterns show they all give way to recovery and growth.
Also, various sectors get hit differently, and a diversified portfolio across asset classes and industries can act as a failsafe.
And lastly, it is crucial to maintain a long-term perspective, strategize with patience, and even take advantage of buying opportunities during the dip.
As it is said, investing is a marathon, not a sprint.

Download Fidelity’s free volatility guide to help navigate turbulent markets.

Please enable JavaScript in your browser to complete this form.Enjoying the data visualization above? *Subscribe
Related Topics: #the great depression #covid19 #US housing market #S&P #the great lockdown #S&P/TSX #investing #Financial Crises #TSX composite #Stock Market Analysis #Recession #Investment Lessons #tsx #Market Resilience #market crash #Investing Tips #global economy #Market Insights #economic recovery #Toronto stock exchange #dot com bubble
Click for Comments
var disqus_shortname = "visualcapitalist.disqus.com";
var disqus_title = "Lessons from Recessions: Analyzing the TSX During Financial Crises";
var disqus_url = "https://www.visualcapitalist.com/sp/lessons-recessions-tsx/";
var disqus_identifier = "visualcapitalist.disqus.com-160479";
You may also like
-
China19 hours ago
Visualizing the Future Global Economy by GDP in 2050
Asia is expected to represent the world’s largest share of real GDP in 2050. See how this all breaks down in one chart.
-
Debt2 days ago
Visualized: U.S. Corporate Bankruptcies On the Rise
In 2023, over 400 companies have folded. This graphic shows how corporate bankruptcies are growing at the second-fastest rate since 2010.
-

Markets3 days ago
The 50 Most Valuable Companies in the World in 2023
The world’s 50 most valuable companies represent over $25 trillion in market cap. We break this massive figure down by company and sector.
-
Markets7 days ago
Charted: The Rise and Fall of WeWork
At the height of its success, WeWork was valued at $47 billion. Four years later, WeWork is worth a fraction of the total. What happened?
-

Maps1 week ago
Visualized: Which Airports Move the Most Cargo?
Cargo that moves through airports represents the value of around 35% of world trade. These hubs move the most cargo globally.
-
Markets1 week ago
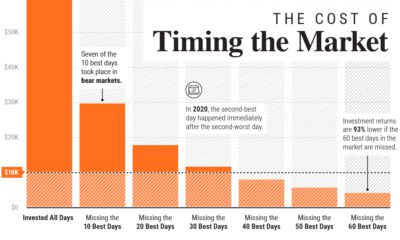
Timing the Market: Why It’s So Hard, in One Chart
In this graphic, we show why timing the market is extremely difficult, and how it can meaningfully dent portfolio returns.
Subscribe
Please enable JavaScript in your browser to complete this form.Join the 375,000+ subscribers who receive our daily email *Sign Up
The post Lessons from Recessions: Analyzing the TSX During Financial Crises appeared first on Visual Capitalist.