![]()
See this visualization first on the Voronoi app.
Use This Visualization
Mapped: America’s Small Business Employment, by State
This was originally posted on our Voronoi app. Download the app for free on iOS or Android and discover incredible data-driven charts from a variety of trusted sources.
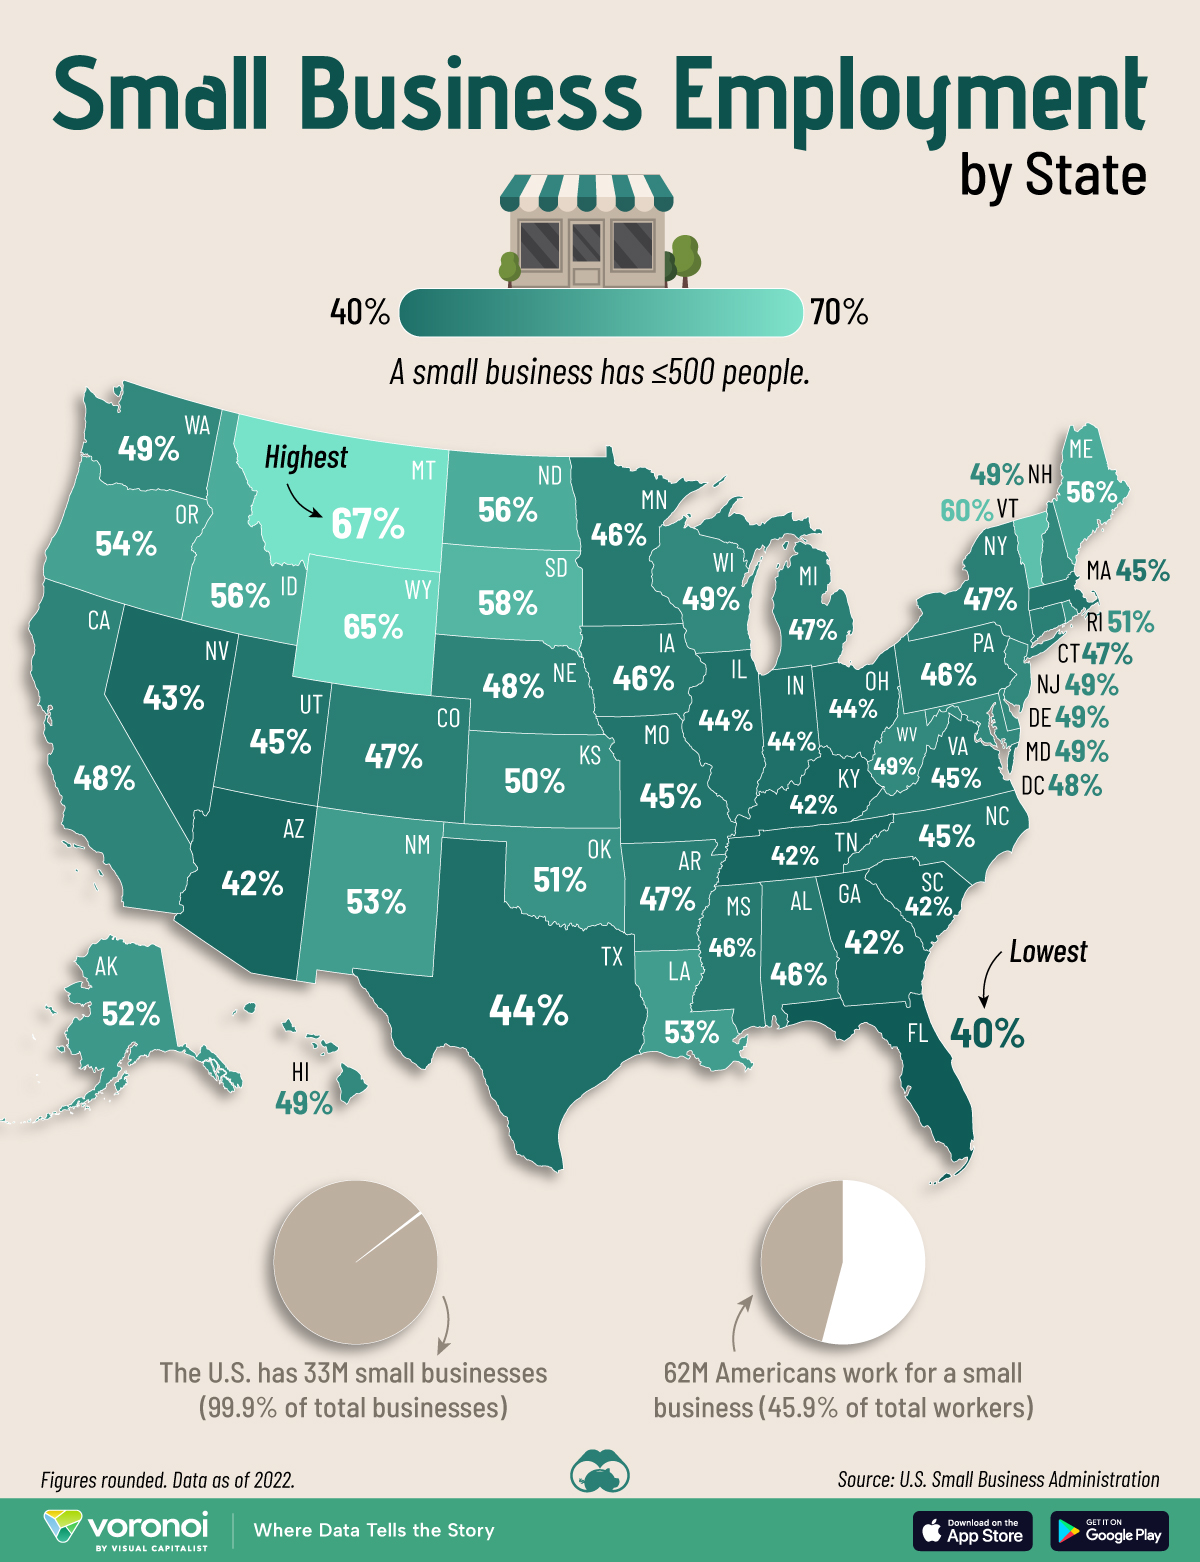
In the U.S., 99.9% of all American businesses are considered a “small business,” defined as a firm with fewer than (or equal to) 500 employees.
This map shows the share of employees in each state who work for a small business. Data is sourced from the U.S. Small Business Administration, as of 2022.
America is Still a Land of Small Businesses
Western states in the interior (Montana, Wyoming) have some of the highest employment share by small businesses. Notably, they are also some of the least populated states in the country.
| Rank | State | State Code | Share of Small Business Employees |
|---|---|---|---|
| 1 | Montana | MT | 67% |
| 2 | Wyoming | WY | 65% |
| 3 | Vermont | VT | 60% |
| 4 | South Dakota | SD | 58% |
| 5 | North Dakota | ND | 56% |
| 6 | Idaho | ID | 56% |
| 7 | Maine | ME | 56% |
| 8 | Oregon | OR | 54% |
| 9 | New Mexico | NM | 53% |
| 10 | Louisiana | LA | 53% |
| 11 | Alaska | AK | 52% |
| 12 | Oklahoma | OK | 51% |
| 13 | Rhode Island | RI | 51% |
| 14 | Kansas | KS | 50% |
| 15 | Washington | WA | 49% |
| 16 | Wisconsin | WI | 49% |
| 17 | Maryland | MD | 49% |
| 18 | New Jersey | NJ | 49% |
| 19 | Delaware | DE | 49% |
| 20 | West Virginia | WV | 49% |
| 21 | New Hampshire | NH | 49% |
| 22 | Hawaii | HI | 49% |
| 23 | California | CA | 48% |
| 24 | Nebraska | NE | 48% |
| 25 | Washington D.C. | DC | 48% |
| 26 | Colorado | CO | 47% |
| 27 | Arkansas | AR | 47% |
| 28 | Michigan | MI | 47% |
| 29 | New York | NY | 47% |
| 30 | Connecticut | CT | 47% |
| 31 | Mississippi | MS | 46% |
| 32 | Iowa | IA | 46% |
| 33 | Minnesota | MN | 46% |
| 34 | Alabama | AL | 46% |
| 35 | Pennsylvania | PA | 46% |
| 36 | Missouri | MO | 45% |
| 37 | Utah | UT | 45% |
| 38 | North Carolina | NC | 45% |
| 39 | Virginia | VA | 45% |
| 40 | Massachusetts | MA | 45% |
| 41 | Texas | TX | 44% |
| 42 | Illinois | IL | 44% |
| 43 | Indiana | IN | 44% |
| 44 | Ohio | OH | 44% |
| 45 | Nevada | NV | 43% |
| 46 | Arizona | AZ | 42% |
| 47 | Tennessee | TN | 42% |
| 48 | Georgia | GA | 42% |
| 49 | South Carolina | SC | 42% |
| 50 | Kentucky | KY | 42% |
| 51 | Florida | FL | 40% |
In contrast, small businesses in Southern states (Florida, Tennessee, Georgia) account for around 40% of those employed in private firms.
Despite a lower employment share, these more populous states still have a higher number of total small business employees. For example, Florida has 3.6 million small business workers, compared to Montana’s 255,000.
Nationwide, small businesses employed 46% of the American workforce in 2022, totaling nearly 62 million people.
Finally, Pew Research found that applications to open small businesses have been trending upwards since 2019. On a per capita basis, Missouri, Wyoming, and Delaware had the most new applications.
Learn More on the Voronoi App ![]()
Most small businesses are mom and pop stores. Check out The States with the Highest and Lowest Share of Family-owned Businesses to compare and contrast with the data in this article.
The post Mapped: America’s Small Business Employment, by State appeared first on Visual Capitalist.