![]()
See more visualizations like this on the Voronoi app.
Use This Visualization
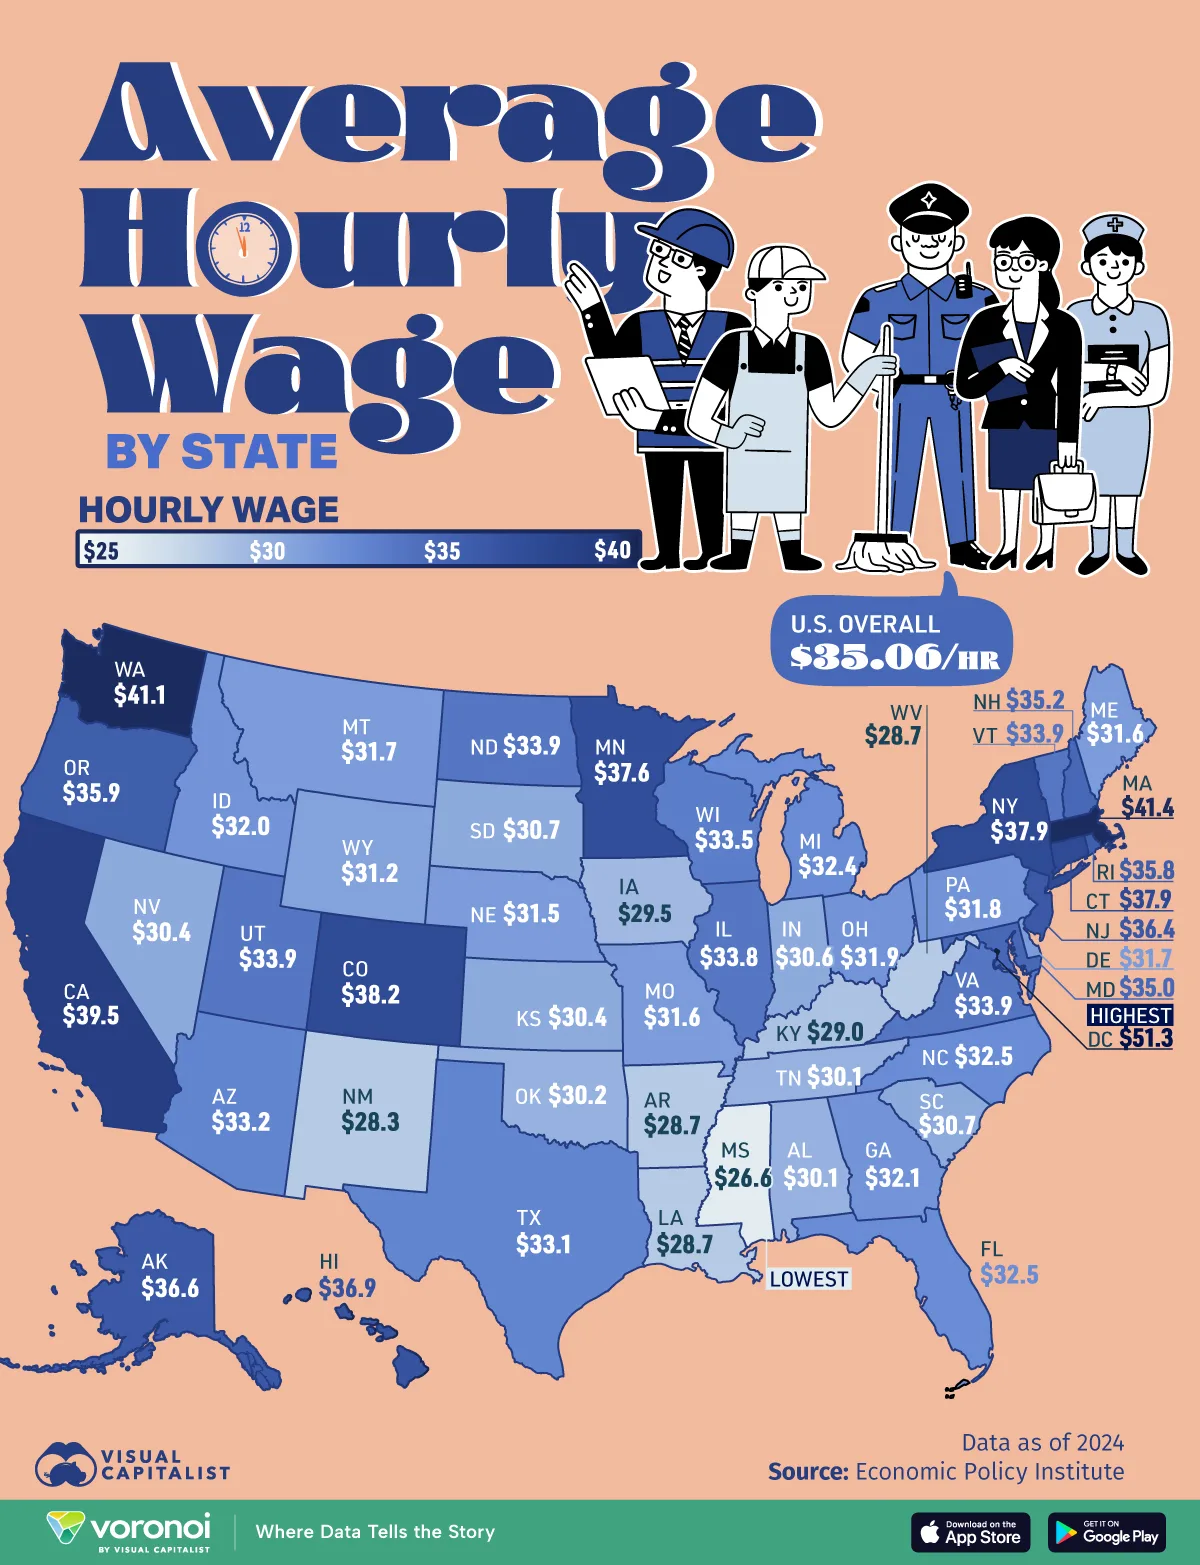
Mapped: The Average Hourly Wage by U.S. State
See visuals like this from many other data creators on our Voronoi app. Download it for free on iOS or Android and discover incredible data-driven charts from a variety of trusted sources.
Key Takeaways
- Washington, D.C. has the highest average hourly wage in the U.S., standing at $51.30.
- Eight of the 10 lowest-paying states are in the South.
U.S. workers earned an average of $35.06 per hour in 2024, an 8.8% rise in real terms since 2015.
Yet there are wide disparities across states. Average real wages in Washington, D.C. are almost double those in Mississippi. Meanwhile, California’s average, at $39.50, is lifted by the concentration of high-paying jobs in the tech sector.
This graphic shows average hourly real wages by state, based on data from the Economic Policy Institute.
Ranked: Average Hourly Wages in 2024
Below, we show a state-by-state comparison of average real wages in America:
| Rank | State | Average Hourly Wage in 2024 |
|---|---|---|
| 1 | District of Columbia | $51.27 |
| 2 | Massachusetts | $41.36 |
| 3 | Washington | $41.07 |
| 4 | California | $39.53 |
| 5 | Colorado | $38.15 |
| 6 | New York | $37.90 |
| 7 | Connecticut | $37.85 |
| 8 | Minnesota | $37.58 |
| 9 | Hawaii | $36.86 |
| 10 | Alaska | $36.57 |
| 11 | New Jersey | $36.41 |
| 12 | Oregon | $35.89 |
| 13 | Rhode Island | $35.79 |
| 14 | New Hampshire | $35.22 |
| 15 | Maryland | $34.99 |
| 16 | Utah | $33.93 |
| 17 | Virginia | $33.90 |
| 18 | North Dakota | $33.88 |
| 19 | Vermont | $33.87 |
| 20 | Illinois | $33.77 |
| 21 | Wisconsin | $33.48 |
| 22 | Arizona | $33.19 |
| 23 | Texas | $33.08 |
| 24 | North Carolina | $32.51 |
| 25 | Florida | $32.50 |
| 26 | Michigan | $32.37 |
| 27 | Georgia | $32.14 |
| 28 | Idaho | $31.99 |
| 29 | Ohio | $31.93 |
| 30 | Pennsylvania | $31.79 |
| 31 | Delaware | $31.72 |
| 32 | Montana | $31.66 |
| 33 | Maine | $31.64 |
| 34 | Missouri | $31.58 |
| 35 | Nebraska | $31.48 |
| 36 | Wyoming | $31.21 |
| 37 | South Dakota | $30.72 |
| 38 | South Carolina | $30.69 |
| 39 | Indiana | $30.58 |
| 40 | Kansas | $30.39 |
| 41 | Nevada | $30.39 |
| 42 | Oklahoma | $30.17 |
| 43 | Alabama | $30.13 |
| 44 | Tennessee | $30.09 |
| 45 | Iowa | $29.51 |
| 46 | Kentucky | $29.02 |
| 47 | Louisiana | $28.70 |
| 48 | West Virginia | $28.69 |
| 49 | Arkansas | $28.65 |
| 50 | New Mexico | $28.26 |
| 51 | Mississippi | $26.60 |
| -- | United States | $35.06 |
As we can see, Washington, D.C. ranks first, boosted by its share of government employees.
In 2024, federal employees made up 25% of its workforce, with the Department of Homeland Security and the Department of Justice employing the highest number of workers.
Massachusetts follows next, with an average hourly wage of $41.36. The state is known as a hub for biotechnology and engineering, where high-paying jobs are prevalent. Additionally, it is home to Harvard University and Massachusetts Institute for Technology, which produce some of the top-paid college graduates in the country.
Ranking in third is Washington, at $41.07. With a minimum wage of $16.66 in 2025, it has one of the nation’s highest. Overall, five of the top 10 states by average real wages are in the West.
On the other hand, Mississippi and New Mexico had the lowest wages in the country. This highlights clear regional differences in salary outcomes in the U.S., driven by lower economic output and lower-paying industries. Moreover, both states have some of the highest rates of extreme poverty, disproportionately affecting minorities and people of color.
Learn More on the Voronoi App ![]()
To learn more about this topic, check out this graphic on median full-time salaries by state.