![]()
See more visuals like this on the Voronoi app.
Use This Visualization
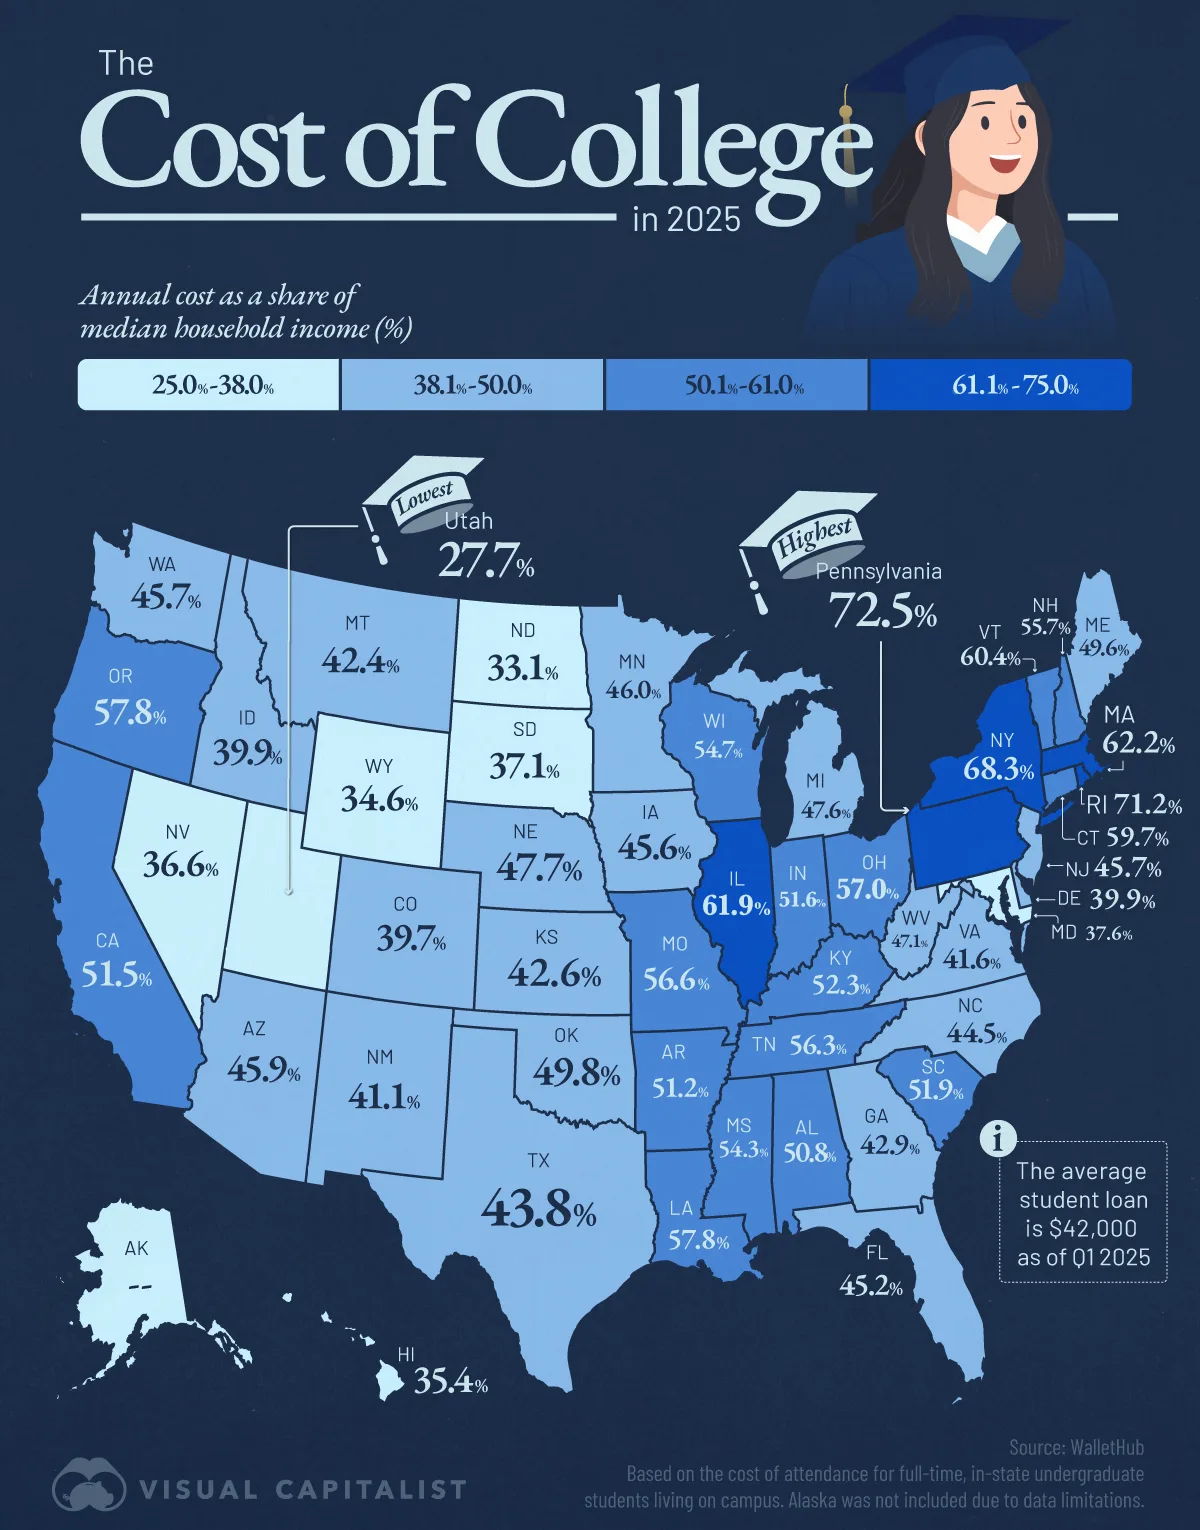
College Costs as a Percentage of Income by U.S. State
See visuals like this from many other data creators on our Voronoi app. Download it for free on iOS or Android and discover incredible data-driven charts from a variety of trusted sources.
Key Takeaways
- The average student loan balance has reached $42,000 as of Q1 2025.
- College is cheapest in Utah, while Pennsylvania ranks as the most burdensome relative to household income.
College affordability continues to be a major concern across the U.S., especially as student loan balances climb. This map breaks down the cost of college in each state based on how much of the median household income is required to cover tuition and education expenses.
The data for this visualization comes from WalletHub. WalletHub analyzed the cost of attendance for full-time, in-state undergraduate students living on campus, across 49 states. Alaska was removed from the sample due to data limitations.
The Most Expensive States for College
Pennsylvania ranks as the least affordable state, with college costs equal to 72.48% of median household income. Rhode Island (71.16%) and New York (68.33%) follow closely. These Northeast states have some of the highest tuition levels in the country, driven by both private and public institutions. Even though Pennsylvania allocates significant funding for student aid, overall costs remain steep enough to outpace most other states.
| Overall Rank | State | College Cost as a% of Household Income |
|---|---|---|
| 1 | Pennsylvania | 72.5% |
| 2 | Rhode Island | 71.2% |
| 3 | New York | 68.3% |
| 4 | Massachusetts | 62.2% |
| 5 | Illinois | 61.9% |
| 6 | Vermont | 60.4% |
| 7 | Connecticut | 59.7% |
| 8 | Louisiana | 57.8% |
| 9 | Oregon | 57.8% |
| 10 | Ohio | 57.0% |
| 11 | Missouri | 56.6% |
| 12 | Tennessee | 56.3% |
| 13 | New Hampshire | 55.7% |
| 14 | Wisconsin | 54.7% |
| 15 | Mississippi | 54.3% |
| 16 | Kentucky | 52.3% |
| 17 | South Carolina | 51.9% |
| 18 | Indiana | 51.6% |
| 19 | California | 51.5% |
| 20 | Arkansas | 51.2% |
| 21 | Alabama | 50.8% |
| 22 | Oklahoma | 49.8% |
| 23 | Maine | 49.6% |
| 24 | Nebraska | 47.7% |
| 25 | Michigan | 47.6% |
| 26 | West Virginia | 47.1% |
| 27 | Minnesota | 46.0% |
| 28 | Arizona | 45.9% |
| 29 | Washington | 45.7% |
| 30 | New Jersey | 45.7% |
| 31 | Iowa | 45.6% |
| 32 | Florida | 45.2% |
| 33 | North Carolina | 44.5% |
| 34 | Texas | 43.8% |
| 35 | Georgia | 42.9% |
| 36 | Kansas | 42.6% |
| 37 | Montana | 42.4% |
| 38 | Virginia | 41.6% |
| 39 | New Mexico | 41.1% |
| 40 | Idaho | 39.9% |
| 41 | Delaware | 39.9% |
| 42 | Colorado | 39.7% |
| 43 | Maryland | 37.6% |
| 44 | South Dakota | 37.1% |
| 45 | Nevada | 36.6% |
| 46 | Hawaii | 35.4% |
| 47 | Wyoming | 34.6% |
| 48 | North Dakota | 33.1% |
| 49 | Utah | 27.7% |
A large portion of states fall between 45% and 60% of median household income. This group includes states like Oregon, Ohio, Missouri, and Tennessee.
The Most Affordable States
Utah stands out as the most affordable state by far, with college costing just 27.69% of median household income.
Strong state funding and relatively low tuition at public universities keep higher education accessible for residents. North Dakota (33.09%) and Wyoming (34.58%) follow, offering similarly manageable cost structures.
Learn More on the Voronoi App ![]()
If you enjoyed today’s post, check out Highest Paying Jobs with No College Degree Required on Voronoi, the new app from Visual Capitalist.