![]()
See more visuals like this on the Voronoi app.
Use This Visualization
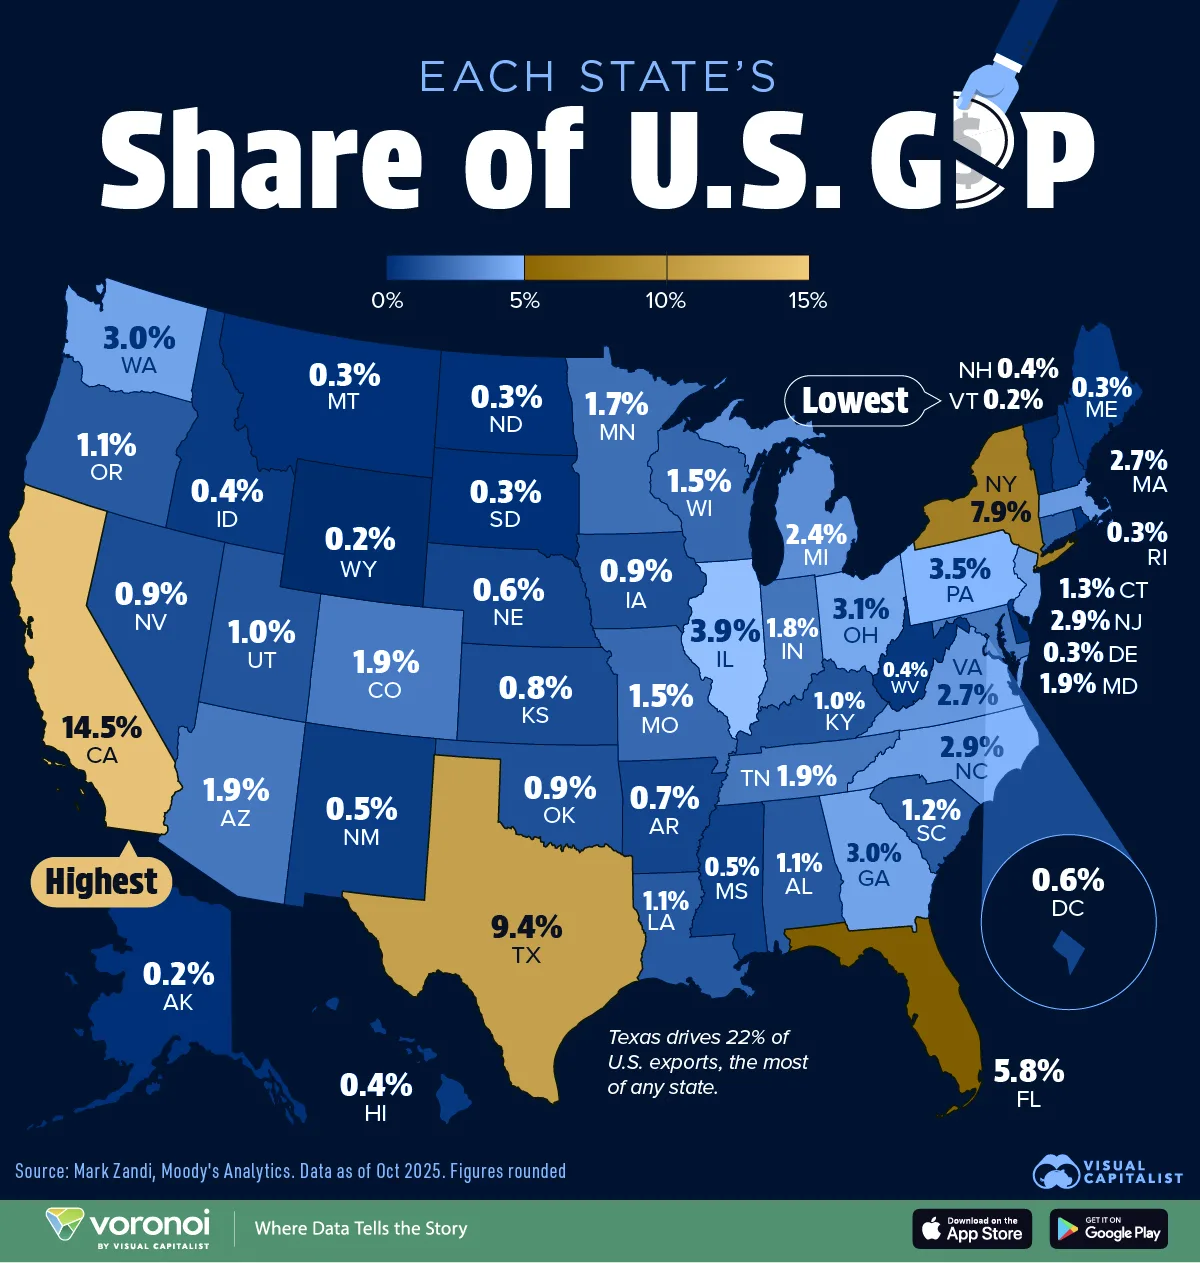
Mapped: Every State’s Share of U.S. GDP
See visuals like this from many other data creators on our Voronoi app. Download it for free on iOS or Android and discover incredible data-driven charts from a variety of trusted sources.
Key Takeaways
- California remains the largest state economy, responsible for 14.5% of U.S. GDP.
- California, Texas, New York, and Florida collectively generate over 37% of national GDP.
- The median U.S. state contributes roughly 1% to 2% of U.S. GDP.
The U.S. economy now exceeds $30 trillion in size, but that output is far from evenly distributed across the country.
While large and economically diverse states like California dominate contributions to national GDP, many smaller states contribute less than 0.5% each.
This infographic maps the share of U.S. GDP by state based on data from Mark Zandi and Moody’s Analytics.
Breaking Down U.S. GDP by State
More than one-third of America’s GDP comes from the top four states—California, Texas, New York, and Florida. These are also the country’s most populous states, which directly impacts their economic size and output.
The table below shows every state’s share of U.S. GDP as of October 2025:
| Rank | State/District | Share of U.S. GDP (%) |
|---|---|---|
| 1 | California | 14.5% |
| 2 | Texas | 9.4% |
| 3 | New York | 7.9% |
| 4 | Florida | 5.8% |
| 5 | Illinois | 3.9% |
| 6 | Pennsylvania | 3.5% |
| 7 | Ohio | 3.1% |
| 8 | Georgia | 3.0% |
| 9 | Washington | 3.0% |
| 10 | New Jersey | 2.9% |
| 11 | North Carolina | 2.9% |
| 12 | Massachusetts | 2.7% |
| 13 | Virginia | 2.7% |
| 14 | Michigan | 2.4% |
| 15 | Colorado | 1.9% |
| 16 | Arizona | 1.9% |
| 17 | Tennessee | 1.9% |
| 18 | Maryland | 1.9% |
| 19 | Indiana | 1.8% |
| 20 | Minnesota | 1.7% |
| 21 | Missouri | 1.5% |
| 22 | Wisconsin | 1.5% |
| 23 | Connecticut | 1.3% |
| 24 | South Carolina | 1.2% |
| 25 | Oregon | 1.1% |
| 26 | Louisiana | 1.1% |
| 27 | Alabama | 1.1% |
| 28 | Utah | 1.0% |
| 29 | Kentucky | 1.0% |
| 30 | Oklahoma | 0.9% |
| 31 | Iowa | 0.9% |
| 32 | Nevada | 0.9% |
| 33 | Kansas | 0.8% |
| 34 | Arkansas | 0.7% |
| 35 | District of Columbia | 0.6% |
| 36 | Nebraska | 0.6% |
| 37 | Mississippi | 0.5% |
| 38 | New Mexico | 0.5% |
| 39 | Idaho | 0.4% |
| 40 | New Hampshire | 0.4% |
| 41 | Hawaii | 0.4% |
| 42 | West Virginia | 0.4% |
| 43 | Delaware | 0.3% |
| 44 | Maine | 0.3% |
| 45 | Rhode Island | 0.3% |
| 46 | North Dakota | 0.3% |
| 47 | Montana | 0.3% |
| 48 | South Dakota | 0.3% |
| 49 | Alaska | 0.2% |
| 50 | Wyoming | 0.2% |
| 51 | Vermont | 0.2% |
California stands far ahead of the rest of the country, generating 14.5% or more than $4 trillion of the national GDP. On its own, California would rank as the fifth-largest economy in the world, with real estate and finance as major drivers of economic output.
Texas follows at 9.4%, fueled by strong energy, technology, and business services sectors. New York ranks third at 7.9%, and Florida (5.8%) rounds out the top four, boosted by tourism, real estate, and strong population growth.
Besides mid-sized states like Illinois and Pennsylvania, most other states account for anywhere between 1 and 3% of U.S. GDP, while 22 states contribute less than 1%, including Vermont, Wyoming, and Alaska.
States At Risk of Recession
In the first 11 months of 2025, U.S. employers announced more than 1.1 million job cuts, marking the sixth time that layoffs have surpassed this threshold since 1993.
Mark Zandi, chief economist at Moody’s Analytics, notes that several states are already seeing slowdowns in economic activity based on indicators such as employment, income, industrial production, and retail sales.
According to Zandi, 23 of the 50 U.S. states are already in recession, and another 12 states, including large economies like California and New York, are “treading water” and at risk of entering recession. You can see recession risk by state mapped out here.
Despite these pressures, the U.S. economy grew by 3.8% in Q2 2025, rebounding from a 0.6% decline in the first quarter.
Learn More on the Voronoi App ![]()
If you enjoyed today’s post, explore more economic insights on Voronoi, including
Unemployment by State.