![]()
See more visualizations like this on the Voronoi app.
Use This Visualization
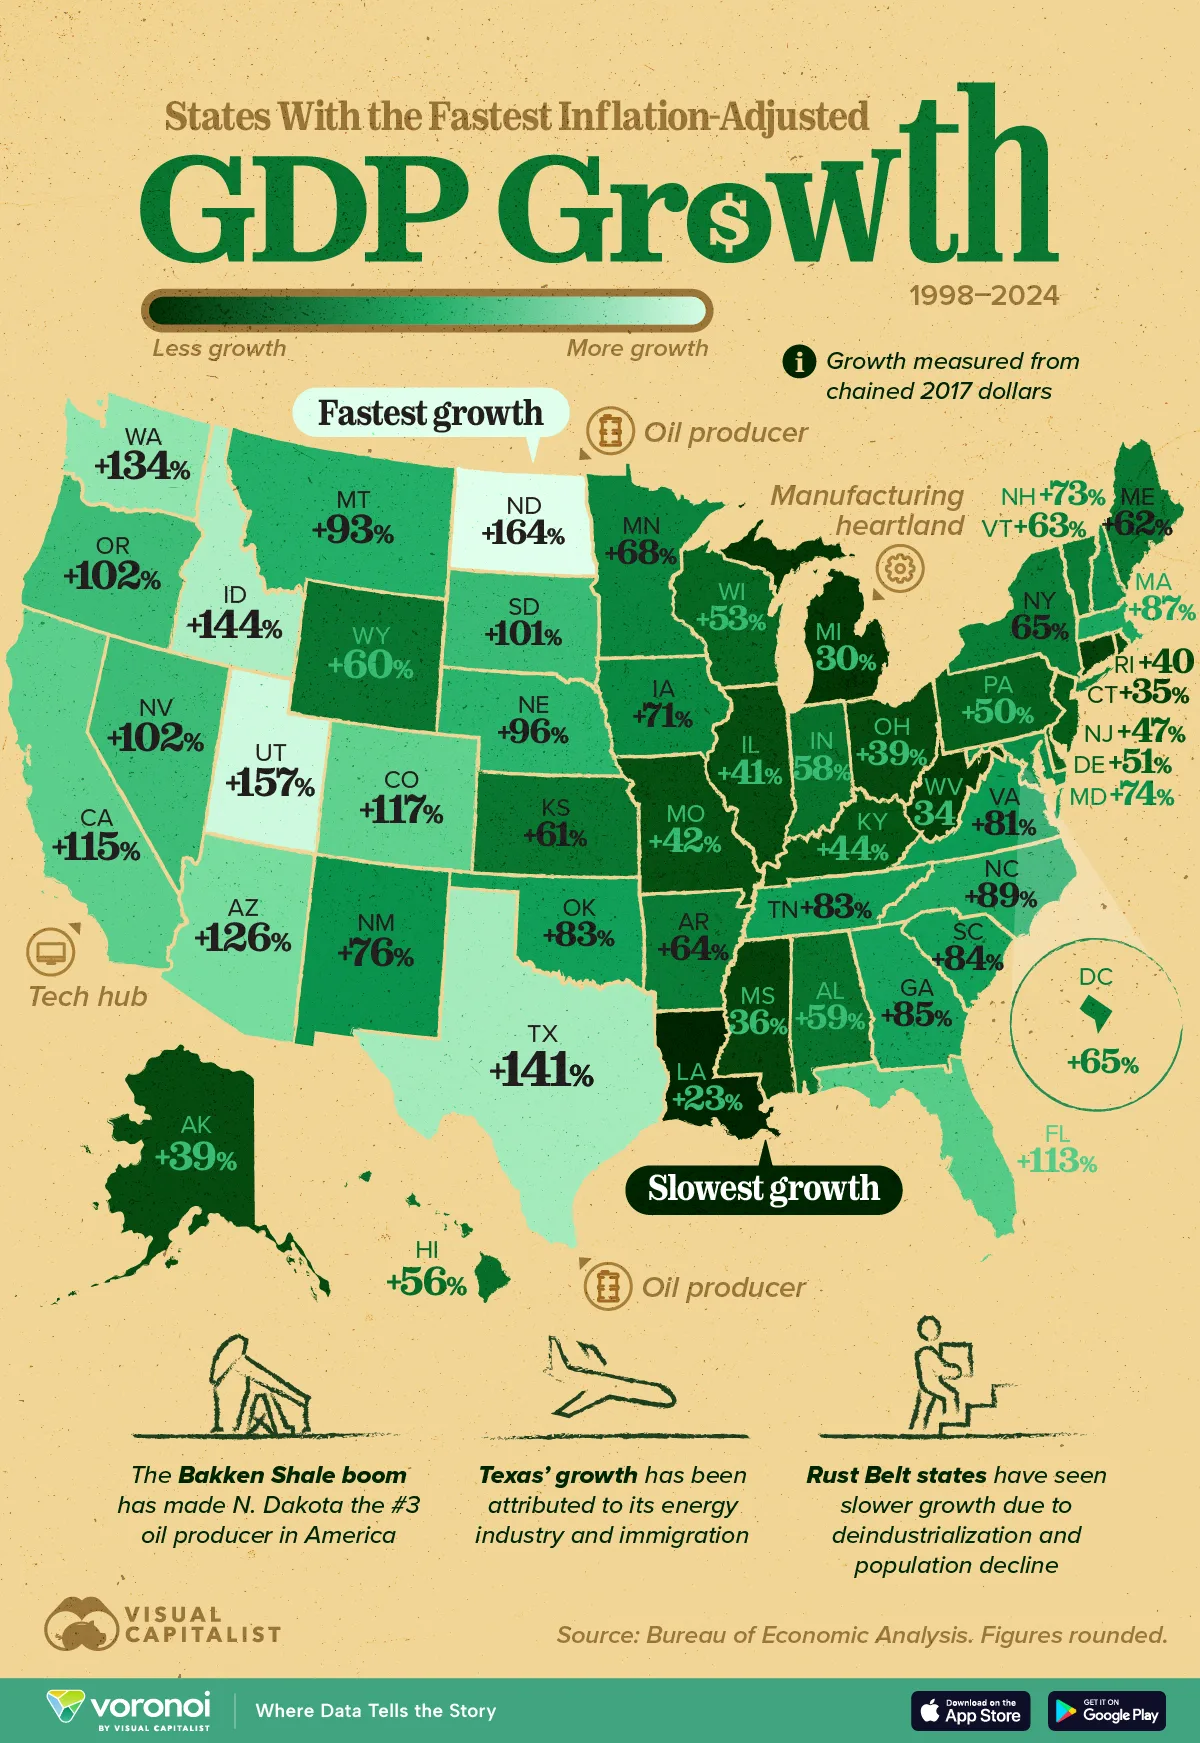
Real GDP Growth by U.S. State (1990-2024)
See visuals like this from many other data creators on our Voronoi app. Download it for free on iOS or Android and discover incredible data-driven charts from a variety of trusted sources.
Key Takeaways
- North Dakota (+164%) and Texas (+141%) posted the most real GDP growth since 1990, powered largely by the shale boom.
- Several Rust Belt and industrial states—including Louisiana, Michigan, and West Virginia—lagged with growth under 35% over the same period.
The 1990s were a different time. Dial-up internet, gas costing a dollar, and many states still leaning on manufacturing.
Even then, new tech clusters and improved drilling methods were starting to reshape the map, setting up today’s energy-rich and tech-focused states for the strongest economies.
The visualization ranks all 50 states and the District of Columbia by inflation-adjusted GDP growth between 1990–2024. Data for real GDP growth by U.S. state is sourced from Bureau of Economic Analysis.
Real GDP growth measured from chained 2017 dollars.
America’s Shale Boom in One Map
North Dakota’s economy more than doubled thanks to the Bakken shale boom, which lifted its real output by 164%—twice the U.S. average.
Texas, already the nation’s largest oil-producing state, followed closely with 141% growth.
| Rank | State | State Code | GDP Growth (1998–2024) | CAGR | 2024 GDP (Billions) |
|---|---|---|---|---|---|
| 1 | North Dakota | ND | 164% | 3.8% | $80,058 |
| 2 | Utah | UT | 157% | 3.7% | $299,471 |
| 3 | Idaho | ID | 144% | 3.5% | $129,018 |
| 4 | Texas | TX | 141% | 3.4% | $2,769,766 |
| 5 | Washington | WA | 134% | 3.3% | $856,014 |
| 6 | Arizona | AZ | 126% | 3.2% | $570,089 |
| 7 | Colorado | CO | 117% | 3.0% | $557,633 |
| 8 | California | CA | 115% | 3.0% | $4,048,108 |
| 9 | Florida | FL | 113% | 3.0% | $1,726,710 |
| 10 | Oregon | OR | 102% | 2.7% | $330,250 |
| 11 | Nevada | NV | 102% | 2.7% | $269,011 |
| 12 | South Dakota | SD | 101% | 2.7% | $76,796 |
| 13 | Nebraska | NE | 96% | 2.6% | $189,243 |
| 14 | Montana | MT | 93% | 2.6% | $78,441 |
| 15 | North Carolina | NC | 89% | 2.5% | $844,209 |
| 16 | Massachusetts | MA | 87% | 2.4% | $778,523 |
| 17 | Georgia | GA | 85% | 2.4% | $881,508 |
| 18 | South Carolina | SC | 84% | 2.4% | $357,074 |
| 19 | Oklahoma | OK | 83% | 2.4% | $263,695 |
| 20 | Tennessee | TN | 83% | 2.3% | $561,201 |
| 21 | Virginia | VA | 81% | 2.3% | $761,734 |
| 22 | New Mexico | NM | 76% | 2.2% | $147,085 |
| 23 | Maryland | MD | 74% | 2.2% | $546,028 |
| 24 | New Hampshire | NH | 73% | 2.1% | $119,337 |
| 25 | Iowa | IA | 71% | 2.1% | $265,795 |
| 26 | Minnesota | MN | 68% | 2.0% | $507,688 |
| 27 | New York | NY | 65% | 2.0% | $2,322,139 |
| 28 | District of Columbia | DC | 65% | 1.9% | $184,298 |
| 29 | Arkansas | AR | 64% | 1.9% | $188,340 |
| 30 | Vermont | VT | 63% | 1.9% | $46,276 |
| 31 | Maine | ME | 62% | 1.9% | $99,174 |
| 32 | Kansas | KS | 61% | 1.9% | $230,522 |
| 33 | Wyoming | WY | 60% | 1.8% | $51,498 |
| 34 | Alabama | AL | 59% | 1.8% | $325,345 |
| 35 | Indiana | IN | 58% | 1.8% | $519,517 |
| 36 | Hawaii | HI | 56% | 1.7% | $117,627 |
| 37 | Wisconsin | WI | 53% | 1.6% | $453,299 |
| 38 | Delaware | DE | 51% | 1.6% | $110,972 |
| 39 | Pennsylvania | PA | 50% | 1.6% | $1,007,874 |
| 40 | New Jersey | NJ | 47% | 1.5% | $846,000 |
| 41 | Kentucky | KY | 44% | 1.4% | $295,375 |
| 42 | Missouri | MO | 42% | 1.4% | $448,714 |
| 43 | Illinois | IL | 41% | 1.3% | $1,148,106 |
| 44 | Rhode Island | RI | 40% | 1.3% | $80,381 |
| 45 | Ohio | OH | 39% | 1.3% | $923,141 |
| 46 | Alaska | AK | 39% | 1.3% | $71,567 |
| 47 | Mississippi | MS | 36% | 1.2% | $158,192 |
| 48 | Connecticut | CT | 35% | 1.2% | $356,835 |
| 49 | West Virginia | WV | 34% | 1.1% | $106,475 |
| 50 | Michigan | MI | 30% | 1.0% | $702,467 |
| 51 | Louisiana | LA | 23% | 0.8% | $329,173 |
| N/A | U.S. | USA | 81% | 2.3% | $29,298,013 |
New Mexico and Oklahoma also landed in the top 20. Cheap feedstock, rising exports of liquefied natural gas (LNG), and associated midstream build-out helped these states capture much of the value created by soaring U.S. energy production.
Related: New Mexico overtook North Dakota as the second-largest oil producing U.S. state.
Tech & Tourism Hubs Sustain Rapid Expansion
Utah (+157%), Idaho (+144%), and Washington (+134%) show how a diversified tech sector can supercharge state-level GDP.
Microsoft’s cloud push, Idaho’s semiconductor fabs, and Utah’s “Silicon Slopes” collectively fostered high-wage job growth and attracted inbound migration.
Even the giant economies of California (+115%) and Florida (+113%) managed to outpace the national average rate of GDP growth by U.S. states. This shows how tech and professional-services clusters spill over into broader economic activity.
Rust Belt and Coastal Laggards
Manufacturing-heavy states in the Midwest and Appalachia largely underperformed. Michigan (+30%) and West Virginia (+34%) never fully recovered the industrial output lost after the early-2000s recession and the Great Financial Crisis.
Connecticut (+35%) and New Jersey (+47%) illustrate how high costs and slow demographic growth weighed on East Coast economies.
Louisiana, hit by multiple hurricanes and refinery shutdowns, posted the slowest gain at just 23%, one-quarter of the national pace.
Learn More on the Voronoi App ![]()
If you enjoyed today’s post, check out The World’s Largest Economies, Including U.S. States on Voronoi, the new app from Visual Capitalist.