![]()
See more visualizations like this on the Voronoi app.
Use This Visualization
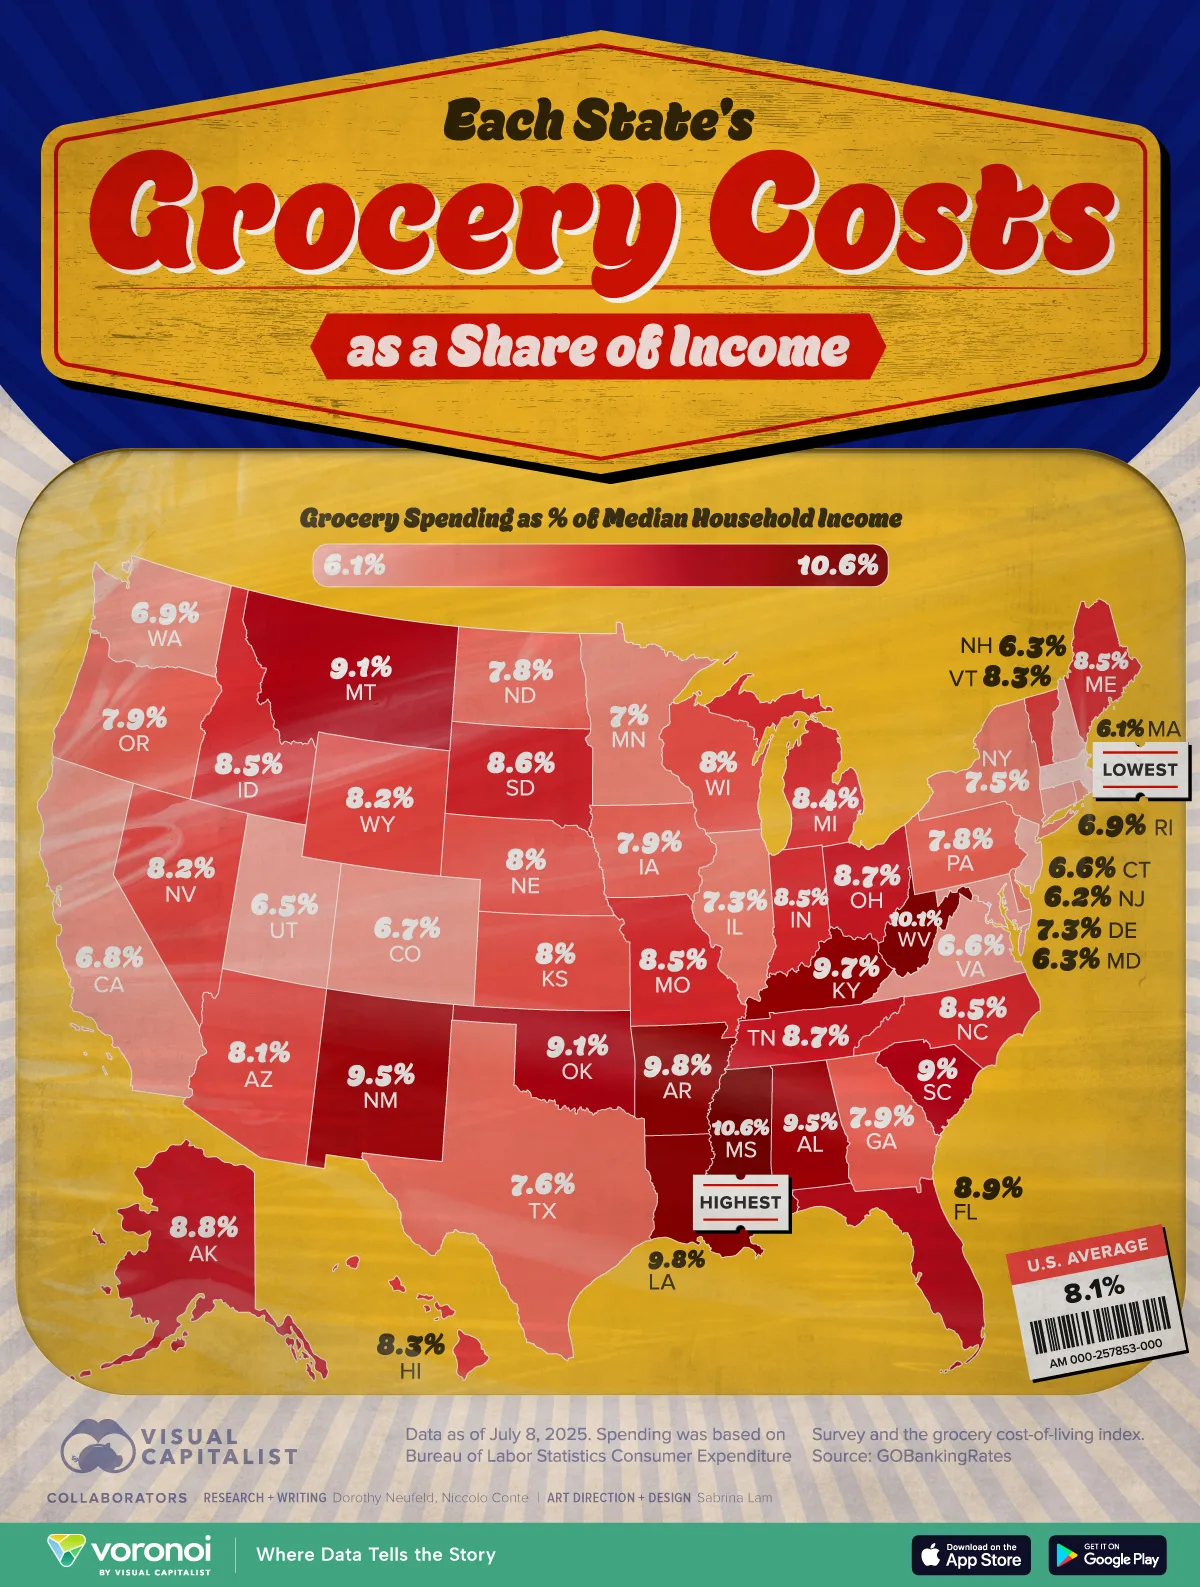
Mapped: Each State’s Average Grocery Bill as a Share of Income
See visuals like this from many other data creators on our Voronoi app. Download it for free on iOS or Android and discover incredible data-driven charts from a variety of trusted sources.
Key Takeaways
- On average, grocery spending accounted for 8.1% of median household income across the United States in 2025.
- In Mississippi, residents spent 10.6% of income on groceries on average, which is the highest share of any state.
Groceries eat up a significant part of your paycheck, but the impact is felt differently across states.
Despite having among the highest grocery prices in the country, Californians spend only 6.8% of income on grocery bills versus the 8.1% U.S. average. In many Southern states, meanwhile, lower median household incomes push grocery spending to a larger share of earnings.
This graphic shows the average grocery bill by state as a share of income, based on analysis from GOBankingRates.
The Average Grocery Bill Hits Hardest in Mississippi
Below, we show average grocery spending relative to median household income by state. Data is from the Bureau of Labor Statistics’ Consumer Expenditure Survey as of July 8, 2025.
| Rank | State | Grocery Spending as % of Median Household Income |
|---|---|---|
| 1 | Mississippi | 10.6% |
| 2 | West Virginia | 10.1% |
| 3 | Arkansas | 9.8% |
| 4 | Louisiana | 9.8% |
| 5 | Kentucky | 9.7% |
| 6 | New Mexico | 9.5% |
| 7 | Alabama | 9.5% |
| 8 | Oklahoma | 9.1% |
| 9 | Montana | 9.1% |
| 10 | South Carolina | 9.0% |
| 11 | Florida | 8.9% |
| 12 | Alaska | 8.8% |
| 13 | Tennessee | 8.7% |
| 14 | Ohio | 8.7% |
| 15 | South Dakota | 8.6% |
| 16 | Missouri | 8.5% |
| 17 | Indiana | 8.5% |
| 18 | Idaho | 8.5% |
| 19 | North Carolina | 8.5% |
| 20 | Maine | 8.5% |
| 21 | Michigan | 8.4% |
| 22 | Hawaii | 8.3% |
| 23 | Vermont | 8.3% |
| 24 | Wyoming | 8.2% |
| 25 | Nevada | 8.2% |
| 26 | Arizona | 8.1% |
| 27 | Kansas | 8.0% |
| 28 | Nebraska | 8.0% |
| 29 | Wisconsin | 8.0% |
| 30 | Georgia | 7.9% |
| 31 | Iowa | 7.9% |
| 32 | Oregon | 7.9% |
| 33 | Pennsylvania | 7.8% |
| 34 | North Dakota | 7.8% |
| 35 | Texas | 7.6% |
| 36 | New York | 7.5% |
| 37 | Delaware | 7.3% |
| 38 | Illinois | 7.3% |
| 39 | Minnesota | 7.0% |
| 40 | Rhode Island | 6.9% |
| 41 | Washington | 6.9% |
| 42 | California | 6.8% |
| 43 | Colorado | 6.7% |
| 44 | Virginia | 6.6% |
| 45 | Connecticut | 6.6% |
| 46 | Utah | 6.5% |
| 47 | Maryland | 6.3% |
| 48 | New Hampshire | 6.3% |
| 49 | New Jersey | 6.2% |
| 50 | Massachusetts | 6.1% |
| -- | U.S. Average | 8.1% |
With $54,915 in median household income and $5,805 in average annual grocery costs, Mississippi residents spend 10.6% of income at the supermarket.
Compared to July 2024, grocery costs have increased 5.7% across the state. Making matters worse, the state has high levels of poverty, with nearly one in five households facing food insecurity.
As we can see, eight of the top 10 states with the highest grocery spending relative income are in the South, including West Virginia, Arkansas, and Louisiana.
Montana (#9) stands out as an exception. While its median household income is higher at $69,922, residents still spend $6,325 annually on groceries. Between July 2024 and July 2025, grocery spending in the state jumped 9.5%, one of the fastest increases nationwide.
By contrast, Massachusetts has the lowest grocery burden overall, largely due to its high median household income of $101,341. As a result, grocery spending accounts for just 6.1% of income.
Overall, states with the lowest grocery cost burden tend to have median household incomes above $90,000 and are primarily concentrated in the West and Northeast.
Learn More on the Voronoi App ![]()
To learn more about this topic, check out this graphic on the global cities with the most expensive groceries.