![]()
See this visualization first on the Voronoi app.
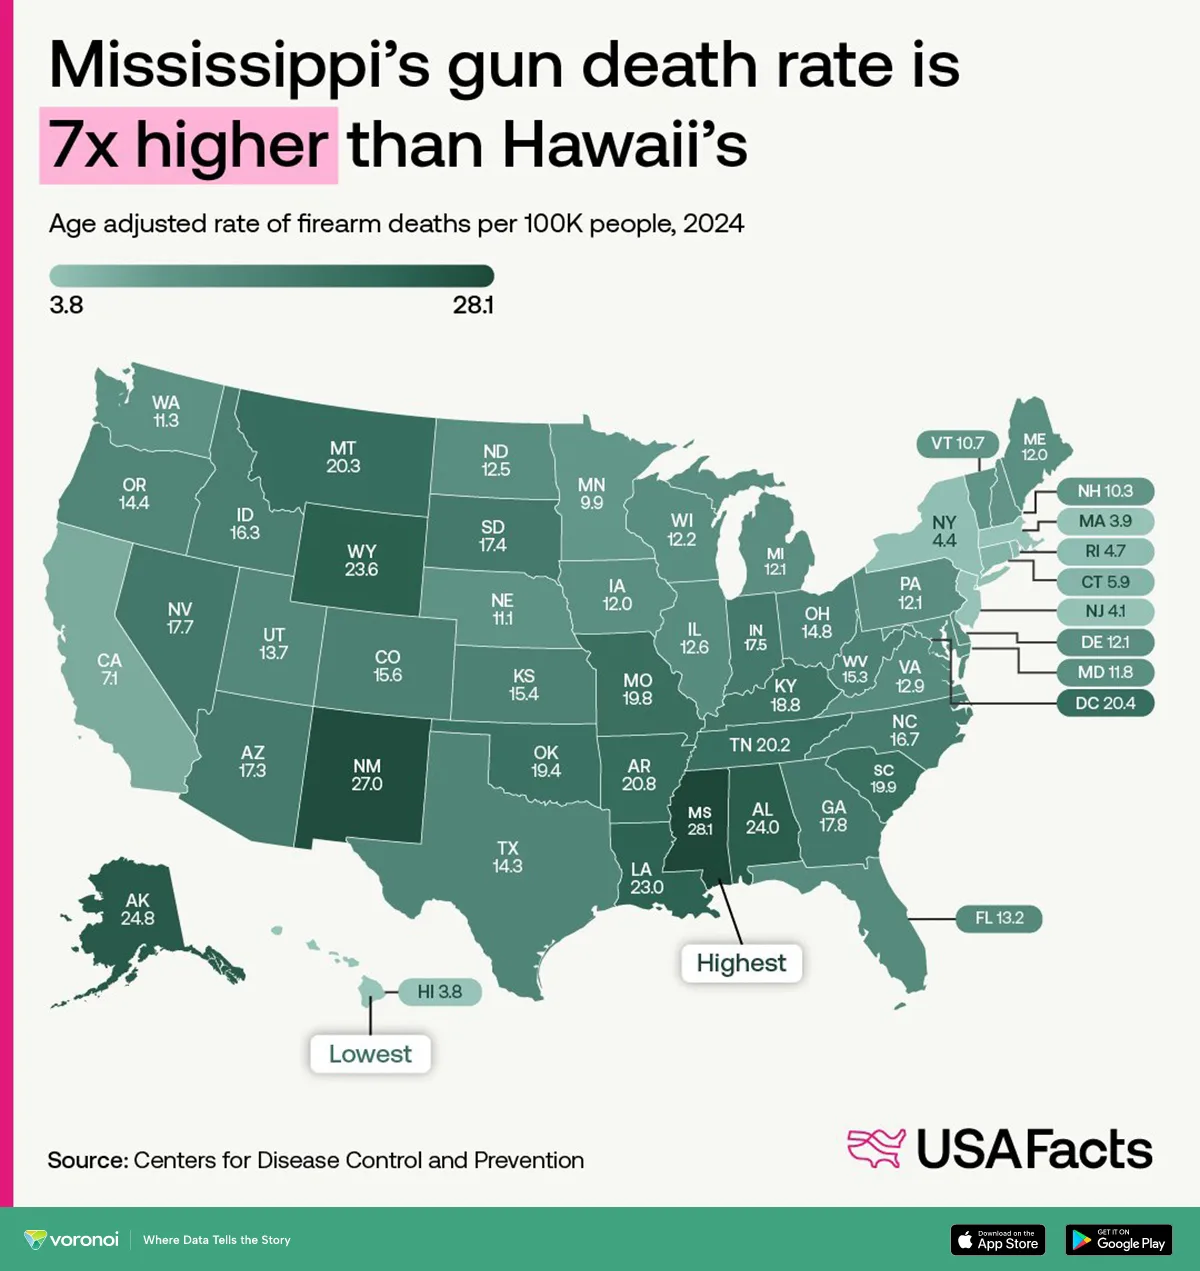
Mapped: How do Gun-Related Death Rates Vary by State?
This was originally posted on our Voronoi app. Download the app for free on iOS or Android and discover incredible data-driven charts from a variety of trusted sources.
- Mississippi has the highest gun death rate in the U.S. at 28.1 per 100K people—over 7 times higher than Hawaii’s.
- The Southern and Western states dominate the upper end of the rankings, while the Northeast reports the lowest rates.
- Gun violence rates often correlate with lax firearm laws, higher gun ownership, and socioeconomic disparities.
Gun violence remains one of the most persistent public health challenges in the United States. While the national conversation often focuses on federal policy, the reality on the ground varies dramatically by state.
The map above, created by USAFacts using data from the Centers for Disease Control and Prevention (CDC), shows the age-adjusted rate of firearm deaths per 100,000 residents in each U.S. state in 2024.
Here is a table of all 50 states and their firearm death rates:
| Rank | State | Firearm Deaths per 100K People (Age Adjusted, 2024) |
|---|---|---|
| 1 | Mississippi | 28.1 |
| 2 | New Mexico | 27.0 |
| 3 | Alaska | 24.8 |
| 4 | Alabama | 24.0 |
| 5 | Wyoming | 23.6 |
| 6 | Louisiana | 23.0 |
| 7 | Arkansas | 20.8 |
| 8 | District of Columbia | 20.4 |
| 9 | Montana | 20.3 |
| 10 | Tennessee | 20.2 |
| 11 | South Carolina | 19.9 |
| 12 | Missouri | 19.8 |
| 13 | Oklahoma | 19.4 |
| 14 | Kentucky | 18.8 |
| 15 | Georgia | 17.8 |
| 16 | Nevada | 17.7 |
| 17 | Indiana | 17.5 |
| 18 | South Dakota | 17.4 |
| 19 | Arizona | 17.3 |
| 20 | North Carolina | 16.7 |
| 21 | Idaho | 16.3 |
| 22 | Colorado | 15.6 |
| 23 | Kansas | 15.4 |
| 24 | West Virginia | 15.3 |
| 25 | Ohio | 14.8 |
| 26 | Oregon | 14.4 |
| 27 | Texas | 14.3 |
| 28 | Utah | 13.7 |
| 29 | Florida | 13.2 |
| 30 | Virginia | 12.9 |
| 31 | Illinois | 12.6 |
| 32 | North Dakota | 12.5 |
| 33 | Wisconsin | 12.2 |
| 34 | Delaware | 12.1 |
| 35 | Michigan | 12.1 |
| 36 | Pennsylvania | 12.1 |
| 37 | Iowa | 12.0 |
| 38 | Maine | 12.0 |
| 39 | Maryland | 11.8 |
| 40 | Washington | 11.3 |
| 41 | Nebraska | 11.1 |
| 42 | Vermont | 10.7 |
| 43 | New Hampshire | 10.3 |
| 44 | Minnesota | 9.9 |
| 45 | California | 7.1 |
| 46 | Connecticut | 5.9 |
| 47 | Rhode Island | 4.7 |
| 48 | New York | 4.4 |
| 49 | New Jersey | 4.1 |
| 50 | Massachusetts | 3.9 |
| 51 | Hawaii | 3.8 |
At a glance, we can see a wide spectrum—from just 3.8 deaths per 100,000 people in Hawaii to over 28 in Mississippi.
U.S. Gun Deaths: A National Crisis with Local Variations
Compared to other high-income nations, the U.S. gun death rate is exceptionally high. However, the disparity becomes even more striking when comparing individual states. Southern states like Mississippi, Louisiana, and Alabama lead the country in firearm mortality, with death rates often double or triple those in Northeastern states like Massachusetts, New Jersey, and New York.
What Drives State-by-State Disparities?
The reasons behind these geographic differences are complex but generally revolve around three key factors:
- Firearm legislation: States with stricter gun laws tend to have lower gun death rates. For example, Hawaii and Massachusetts have some of the strongest firearm restrictions and the lowest death rates.
- Gun ownership: Higher rates of gun ownership are associated with more firearm-related deaths, whether by homicide or suicide.
- Socioeconomic conditions: Poverty, lack of access to mental health care, and social instability all contribute to higher rates of gun violence.
The Role of Culture and History
In many parts of the U.S., particularly in the South and Mountain West, firearms are deeply embedded in the cultural fabric. Hunting, self-defense, and strong support for Second Amendment rights shape policy decisions and public sentiment, making any statewide gun control efforts politically challenging.
Meanwhile, urban areas in lower-death-rate states still face localized spikes in gun violence, often driven by factors such as gang activity. This underscores how state-level averages can mask important within-state variations.
Related reading: Mapped: U.S. States With the Most Guns
Learn More on the Voronoi App
Explore more data-rich visuals like this in our recommended post: 30 Years of Gun Manufacturing in America.