![]()
See this visualization first on the Voronoi app.
Use This Visualization
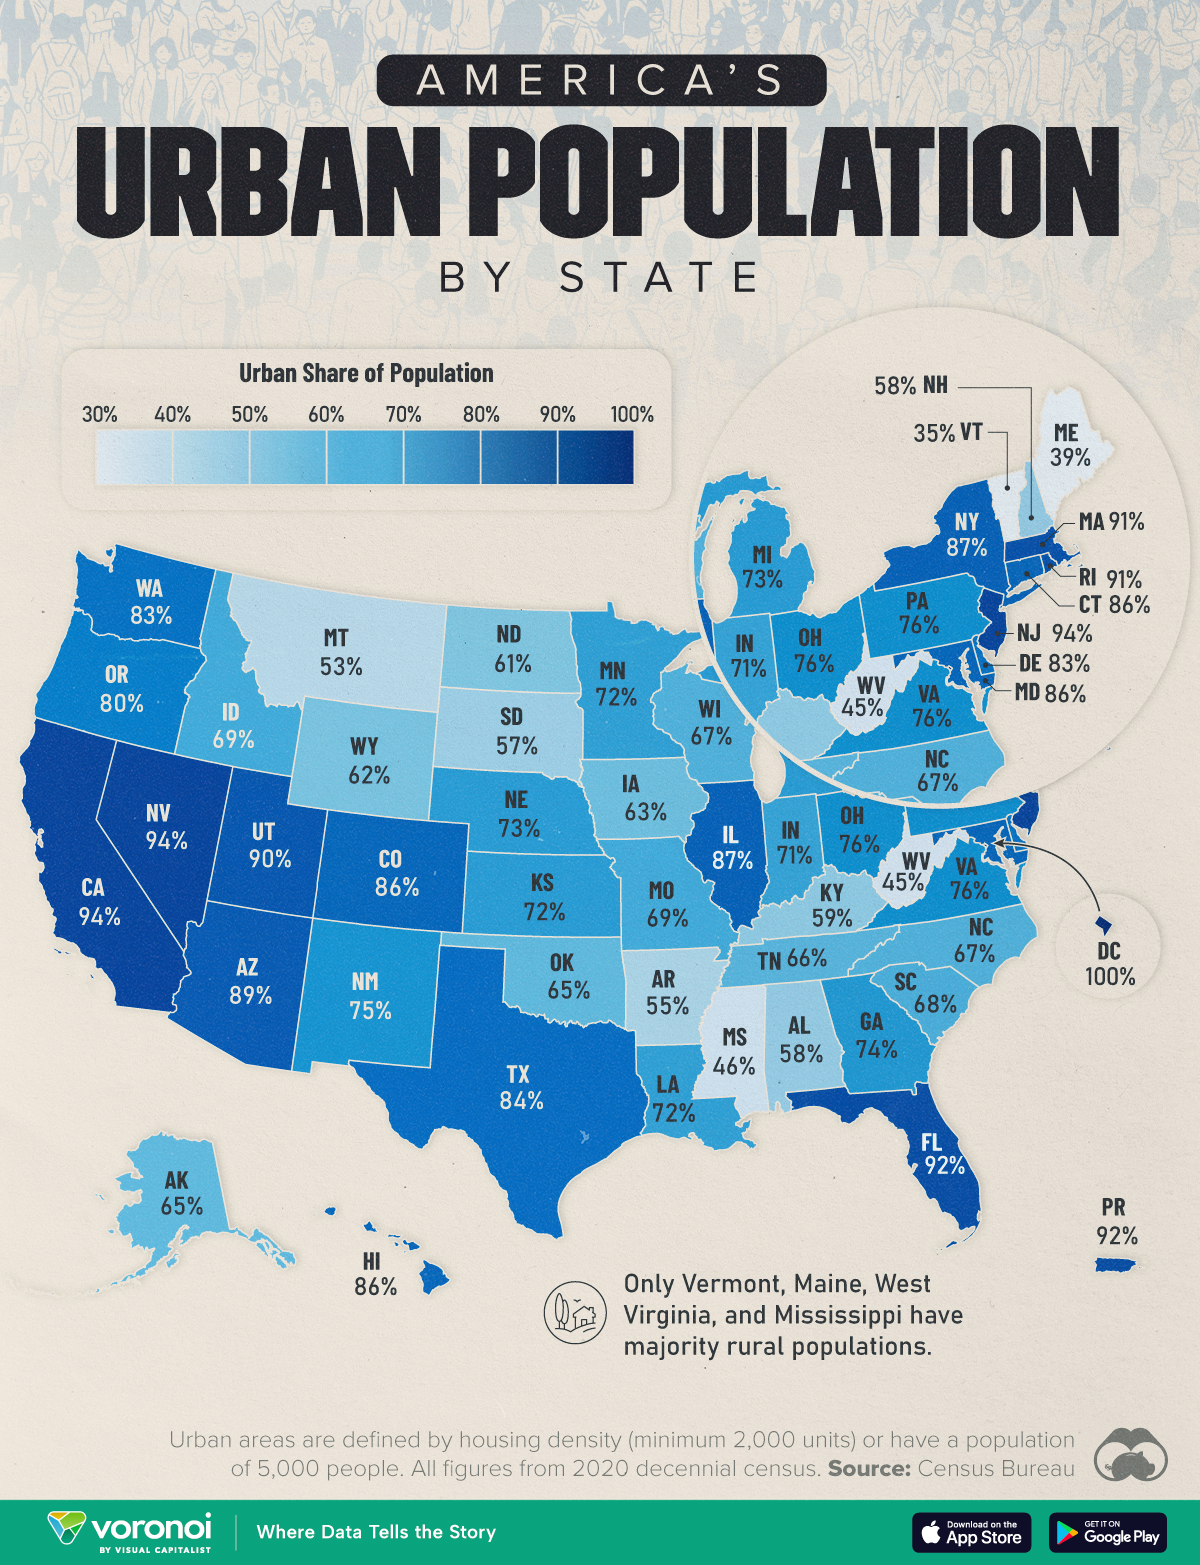
Mapped: The Share of Each State’s Population That Lives in Cities
This was originally posted on our Voronoi app. Download the app for free on iOS or Android and discover incredible data-driven charts from a variety of trusted sources.
Since the Industrial Revolution, the U.S. (along with much of the rest of the world) has urbanized. Currently almost 80% of the entire country’s population lives in cities.
However country-wide statistics can mask variations between regions. This graphic maps the share of urban population by state, per latest estimates from the Census Bureau. According to them, an urban area must “encompass at least 2,000 housing units or have a population of at least 5,000 people.”
The States with the Highest Share of Urban Populations
For seven U.S. states, (California, Nevada, New Jersey, Florida, Massachusetts, Rhode Island, and Utah), 90% or more of the population lives in cities. They also tend to have large urban centers, with 250,000 or more residents.
| Rank | State | Urban Population | Rural Population |
|---|---|---|---|
| 1 | Washington D.C.* | 100% | 0% |
| 2 | California | 94% | 6% |
| 3 | Nevada | 94% | 6% |
| 4 | New Jersey | 94% | 6% |
| 5 | Puerto Rico** | 92% | 8% |
| 6 | Florida | 92% | 8% |
| 7 | Massachusetts | 91% | 9% |
| 8 | Rhode Island | 91% | 9% |
| 9 | Utah | 90% | 10% |
| 10 | Arizona | 89% | 11% |
| 11 | New York | 87% | 13% |
| 12 | Illinois | 87% | 13% |
| 13 | Connecticut | 86% | 14% |
| 14 | Hawaii | 86% | 14% |
| 15 | Colorado | 86% | 14% |
| 16 | Maryland | 86% | 14% |
| 17 | Texas | 84% | 16% |
| 18 | Washington | 83% | 17% |
| 19 | Delaware | 83% | 17% |
| 20 | Oregon | 80% | 20% |
| 21 | Pennsylvania | 76% | 24% |
| 22 | Ohio | 76% | 24% |
| 23 | Virginia | 76% | 24% |
| 24 | New Mexico | 75% | 25% |
| 25 | Georgia | 74% | 26% |
| 26 | Michigan | 73% | 27% |
| 27 | Nebraska | 73% | 27% |
| 28 | Kansas | 72% | 28% |
| 29 | Minnesota | 72% | 28% |
| 30 | Louisiana | 72% | 28% |
| 31 | Indiana | 71% | 29% |
| 32 | Missouri | 69% | 31% |
| 33 | Idaho | 69% | 31% |
| 34 | South Carolina | 68% | 32% |
| 35 | Wisconsin | 67% | 33% |
| 36 | North Carolina | 67% | 33% |
| 37 | Tennessee | 66% | 34% |
| 38 | Alaska | 65% | 35% |
| 39 | Oklahoma | 65% | 35% |
| 40 | Iowa | 63% | 37% |
| 41 | Wyoming | 62% | 38% |
| 42 | North Dakota | 61% | 39% |
| 43 | Kentucky | 59% | 41% |
| 44 | New Hampshire | 58% | 42% |
| 45 | Alabama | 58% | 42% |
| 46 | South Dakota | 57% | 43% |
| 47 | Arkansas | 55% | 45% |
| 48 | Montana | 53% | 47% |
| 49 | Mississippi | 46% | 54% |
| 50 | West Virginia | 45% | 55% |
| 51 | Maine | 39% | 61% |
| 52 | Vermont | 35% | 65% |
*Federal district. **U.S. territory. Figures rounded.
Puerto Rico’s populace is also 92% urban, and of course Washington D.C. has the rare distinction of being entirely (100%) urban.
Looking at the map, it’s possible to see some patterns in urban populations. The West Coast, for example, is all uniformly a darker blue, indicating a higher population share living in cities. The same can be said for most of the East Coast.
The less-populated Mountain and Midwest states (Montana, Wyoming, and the Dakotas) are more balanced with a 60-40 urban-rural split. In Midwestern states like Minnesota, Indiana, and Ohio, the urban share begins to grow.
Only four states, Vermont, Maine, West Virginia, and Mississippi have majority rural populations in the entire country.
The latter two, along with other states with a higher share of rural residents (including Arkansas, Kentucky, and Alabama) tend to have higher poverty rates as well.
Importantly, these are all percentage shares of a state population. So the more populous states (California, Texas, New York) still have rural residents who’d outnumber entire parts of the country.
Learn More on the Voronoi App ![]()
The Census Bureau collects a wealth of information about Americans. Check out Obesity Rates by State for a look at other regional patterns in the country.
The post Mapped: How Much of Each U.S. State’s Population Lives in Cities appeared first on Visual Capitalist.