![]()
See more visuals like this on the Voronoi app.
Use This Visualization
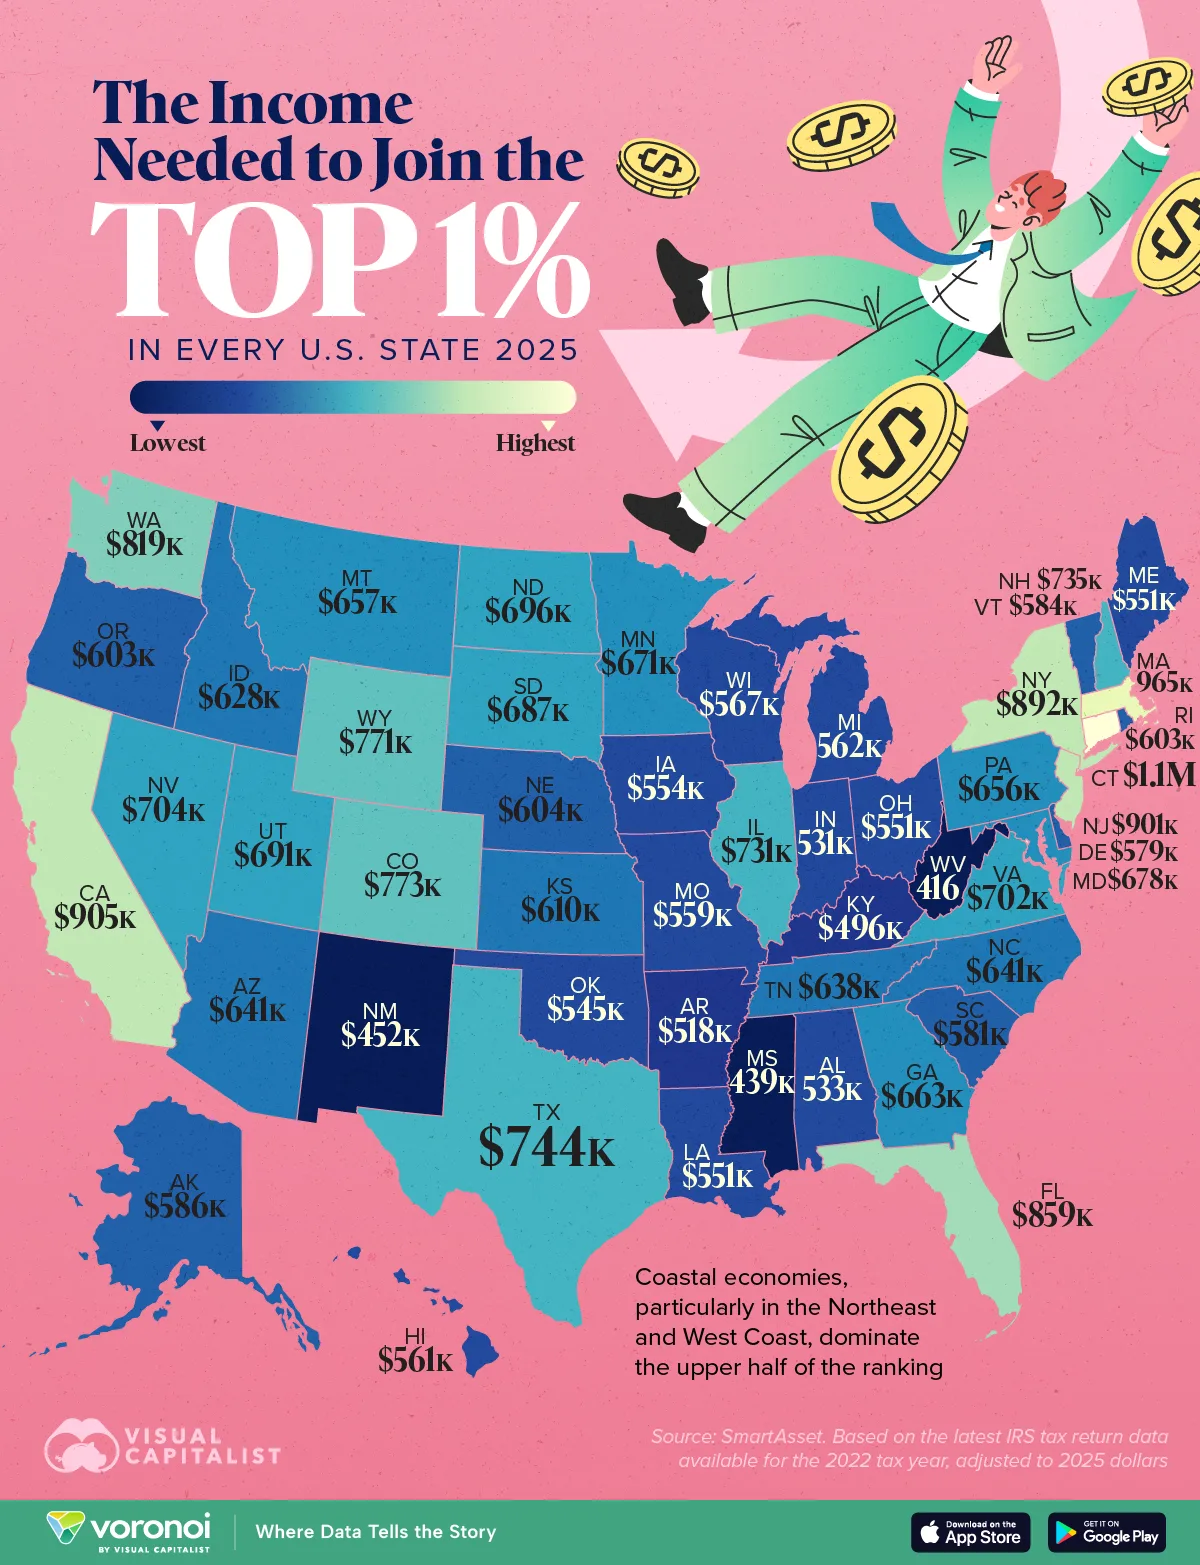
Mapped: Income Needed to Join the Top 1% by State (2025)
See visuals like this from many other data creators on our Voronoi app. Download it for free on iOS or Android and discover incredible data-driven charts from a variety of trusted sources.
Key Takeaways
- Coastal economies, particularly in the Northeast and on the West Coast, dominate the upper half of the ranking.
- Connecticut leads the nation, where you’d need to earn more than $1.05 million to join the top 1% by income.
What it takes to join the top 1% of earners varies across the United States. This map highlights the income floor required to enter the wealthiest bracket in each state for 2025. The spread is wide, stretching from over $1 million at the top to barely $400,000 in less wealthy states.
High-paying industries like finance, technology, and professional services cluster in coastal states, pushing top incomes even higher. Meanwhile, states with smaller economies and lower costs of living require far less to reach the elite group.
The data for this visualization comes from SmartAsset. It ranks all 50 states by the annual income required to enter the top 1%, based on tax return data. The table below also includes the number of households in this bracket and the corresponding income floor for the top 5%.
Where You Need the Most to Join the 1%
Connecticut tops the list with a $1,056,996 income floor, making it the only state above the $1 million mark.
| Rank | State | Top 1% of earners | # of top 1% returns | Top 5% of earners |
|---|---|---|---|---|
| 1 | Connecticut | $1,056,996 | 16,917 | $362,263 |
| 2 | Massachusetts | $965,170 | 32,795 | $378,434 |
| 3 | California | $905,396 | 175,045 | $353,073 |
| 4 | New Jersey | $901,082 | 43,042 | $367,108 |
| 5 | New York | $891,640 | 91,840 | $307,753 |
| 6 | Florida | $859,381 | 105,101 | $281,811 |
| 7 | Washington | $819,101 | 35,597 | $355,767 |
| 8 | Colorado | $772,989 | 27,685 | $318,659 |
| 9 | Wyoming | $771,369 | 2,611 | $255,320 |
| 10 | Texas | $743,955 | 128,130 | $284,661 |
| 11 | New Hampshire | $735,374 | 6,796 | $311,145 |
| 12 | Illinois | $731,202 | 56,794 | $292,729 |
| 13 | Nevada | $703,713 | 14,754 | $248,739 |
| 14 | Virginia | $701,792 | 39,103 | $314,694 |
| 15 | North Dakota | $695,759 | 3,431 | $272,755 |
| 16 | Utah | $690,548 | 13,991 | $270,645 |
| 17 | South Dakota | $687,190 | 4,062 | $255,851 |
| 18 | Maryland | $677,543 | 29,040 | $304,250 |
| 19 | Minnesota | $671,408 | 26,423 | $285,607 |
| 20 | Georgia | $662,821 | 46,220 | $267,958 |
| 21 | Montana | $656,830 | 5,101 | $251,774 |
| 22 | Pennsylvania | $655,636 | 58,541 | $272,141 |
| 23 | Arizona | $641,262 | 31,872 | $261,362 |
| 24 | North Carolina | $640,783 | 46,525 | $268,730 |
| 25 | Tennessee | $638,299 | 30,531 | $247,765 |
| 26 | Idaho | $627,839 | 8,145 | $249,451 |
| 27 | Kansas | $609,946 | 12,643 | $253,834 |
| 28 | Nebraska | $603,899 | 8,660 | $251,139 |
| 29 | Rhode Island | $603,162 | 5,224 | $258,276 |
| 30 | Oregon | $603,006 | 19,053 | $270,877 |
| 31 | Alaska | $586,381 | 3,223 | $266,499 |
| 32 | Vermont | $583,559 | 3,123 | $249,931 |
| 33 | South Carolina | $580,600 | 23,203 | $241,531 |
| 34 | Delaware | $578,580 | 4,726 | $260,787 |
| 35 | Wisconsin | $566,711 | 27,293 | $242,066 |
| 36 | Michigan | $561,582 | 45,218 | $241,403 |
| 37 | Hawaii | $561,147 | 6,472 | $249,850 |
| 38 | Missouri | $559,043 | 26,898 | $237,461 |
| 39 | Iowa | $554,046 | 13,821 | $241,591 |
| 40 | Louisiana | $551,125 | 18,593 | $225,674 |
| 41 | Maine | $550,936 | 6,618 | $236,338 |
| 42 | Ohio | $550,724 | 53,103 | $232,196 |
| 43 | Oklahoma | $544,679 | 16,106 | $224,074 |
| 44 | Alabama | $532,600 | 20,185 | $226,634 |
| 45 | Indiana | $531,332 | 30,120 | $227,098 |
| 46 | Arkansas | $517,761 | 12,198 | $217,087 |
| 47 | Kentucky | $496,281 | 18,395 | $215,196 |
| 48 | New Mexico | $451,639 | 9,310 | $211,101 |
| 49 | Mississippi | $439,479 | 11,731 | $195,171 |
| 50 | West Virginia | $416,310 | 7,316 | $196,335 |
Massachusetts ($965,170) and California ($905,396) follow in second and third place, both supported by large, high-skill job markets. States in the Northeast and along the West Coast dominate the top positions due to dense economic activity and elevated earnings in specialized industries.
Middle-Tier States Still Require High Earnings
States like Colorado, Washington, and Virginia sit in the upper-middle tier, requiring between $700,000 and $820,000 to qualify for the top 1%. These states benefit from fast-growing metropolitan areas, strong tech or government-driven employment, and rising household incomes.
Even in energy-focused states such as Wyoming and North Dakota, the income floors exceed $690,000, showing how pockets of high-paying industries influence overall thresholds.
The Most Affordable States for Top 1% Status
At the bottom of the ranking, West Virginia’s $416,310 threshold is the lowest in the country, followed by Mississippi ($439,479) and New Mexico ($451,639). Lower costs of living, smaller urban job markets, and fewer high-paying industry clusters contribute to these more modest thresholds.
Learn More on the Voronoi App ![]()
If you enjoyed today’s post, check out Visualizing the Cost of the American Dream on Voronoi, the new app from Visual Capitalist.