![]()
See more visualizations like this on the Voronoi app.
Use This Visualization
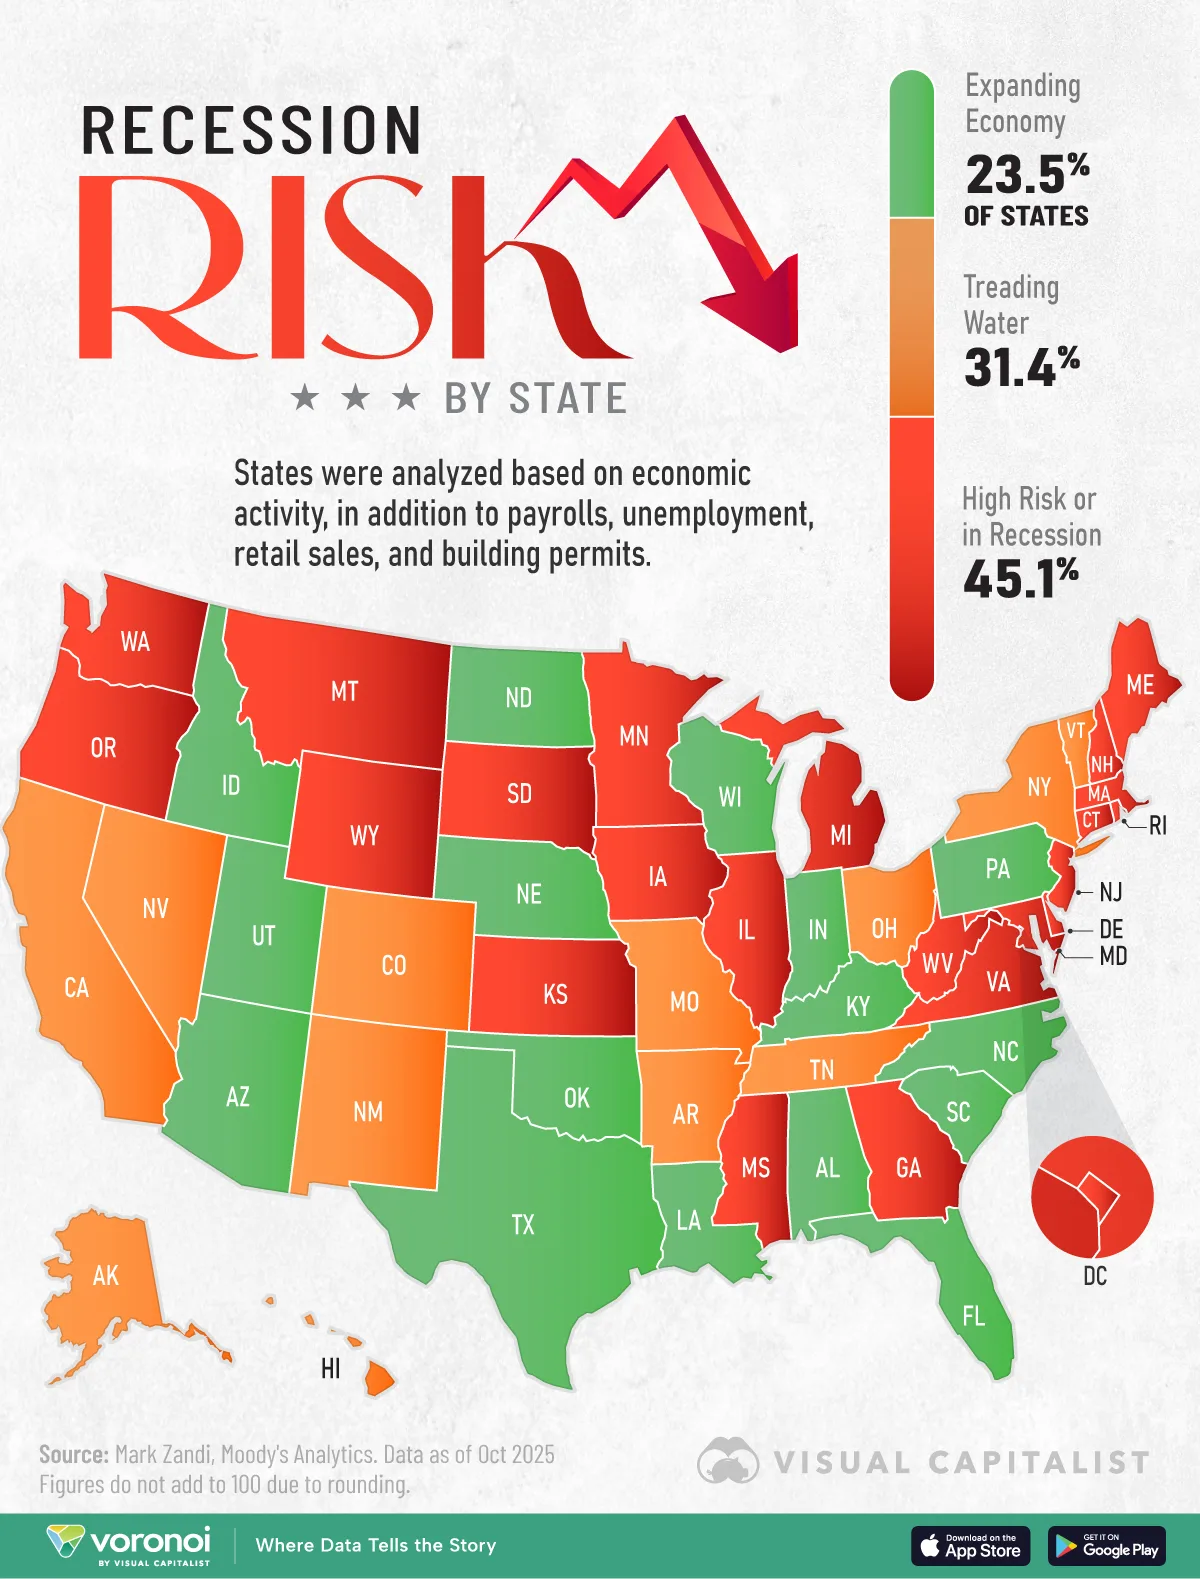
Mapped: Recession Risk by State in 2025
See visuals like this from many other data creators on our Voronoi app. Download it for free on iOS or Android and discover incredible data-driven charts from a variety of trusted sources.
Key Takeaways
- As of October, 23 U.S. states face high recession risk, or are already in recession.
- By contrast, 16 states, including Texas and Kentucky, are expanding based on analysis from Moody’s.
U.S. GDP is made up of many smaller, distinct state economies fueling national growth.
In 2025, states responsible for about a third of U.S. GDP are in recession, or face high recession risk. Another third are expanding, including Florida and Utah, based on payrolls, employment, and other key economic data.
This graphic shows recession risk by state in 2025, based on analysis from Mark Zandi, chief economist at Moody’s Analytics.
Where Recession Risk is Highest in America
To analyze recession risk, Zandi looks at state-level economic activity. This included a range of data such as unemployment, building permits, retail sales, industrial activity, delinquency rates, and tax revenues.
States were then categorized into three buckets based on these factors as of October 2025:
- In Recession/High Risk
- Treading Water
- Expanding
| State/District | Business Cycle Status | Share of U.S. GDP (%) |
|---|---|---|
| Georgia | In Recession/High Risk | 3.03 |
| Montana | In Recession/High Risk | 0.25 |
| Wyoming | In Recession/High Risk | 0.18 |
| Michigan | In Recession/High Risk | 2.44 |
| Massachusetts | In Recession/High Risk | 2.73 |
| Mississippi | In Recession/High Risk | 0.53 |
| Minnesota | In Recession/High Risk | 1.70 |
| Kansas | In Recession/High Risk | 0.80 |
| Rhode Island | In Recession/High Risk | 0.28 |
| Delaware | In Recession/High Risk | 0.34 |
| Washington | In Recession/High Risk | 3.02 |
| Illinois | In Recession/High Risk | 3.85 |
| West Virginia | In Recession/High Risk | 0.36 |
| New Hampshire | In Recession/High Risk | 0.42 |
| Maryland | In Recession/High Risk | 1.86 |
| Virginia | In Recession/High Risk | 2.66 |
| South Dakota | In Recession/High Risk | 0.25 |
| Connecticut | In Recession/High Risk | 1.27 |
| Oregon | In Recession/High Risk | 1.14 |
| Iowa | In Recession/High Risk | 0.86 |
| New Jersey | In Recession/High Risk | 2.93 |
| Maine | In Recession/High Risk | 0.33 |
| District of Columbia | In Recession/High Risk | 0.64 |
| Missouri | Treading Water | 1.54 |
| Ohio | Treading Water | 3.14 |
| Hawaii | Treading Water | 0.39 |
| Arkansas | Treading Water | 0.65 |
| New Mexico | Treading Water | 0.49 |
| Tennessee | Treading Water | 1.87 |
| New York | Treading Water | 7.92 |
| Vermont | Treading Water | 0.16 |
| Alaska | Treading Water | 0.24 |
| Colorado | Treading Water | 1.92 |
| California | Treading Water | 14.50 |
| Nevada | Treading Water | 0.86 |
| South Carolina | Expanding | 1.18 |
| Texas | Expanding | 9.41 |
| Oklahoma | Expanding | 0.92 |
| Idaho | Expanding | 0.43 |
| Kentucky | Expanding | 0.99 |
| Alabama | Expanding | 1.10 |
| Indiana | Expanding | 1.81 |
| Nebraska | Expanding | 0.63 |
| North Carolina | Expanding | 2.86 |
| Louisiana | Expanding | 1.11 |
| Florida | Expanding | 5.78 |
| North Dakota | Expanding | 0.26 |
| Pennsylvania | Expanding | 3.54 |
| Arizona | Expanding | 1.88 |
| Wisconsin | Expanding | 1.53 |
| Utah | Expanding | 1.02 |
Currently, many coastal, Northeastern states are facing some of the worst economic conditions.
In Maine, for instance, year-over-year GDP growth is just 0.8% as of Q2 2025, compared to the U.S. average of 2.1%. Meanwhile, Washington, D.C.’s unemployment rate was 6.4% in July, significantly higher than the 4.6% U.S. average given sweeping federal cuts.
According to Zandi’s analysis, New York and California are “Treading Water”, together responsible for driving over 22% of U.S. GDP.
In comparison, Texas, which fuels 9.4% of U.S. economic growth is expanding. Unemployment rates of 4.0% in July remain below the U.S. average. Additionally, the Texas economy is growing faster than the nation, while income growth rose 6.3% annually as of Q2 2025, outpacing the national average.
Learn More on the Voronoi App ![]()
To learn more about this topic, check out this graphic on unemployment by state in 2025.